
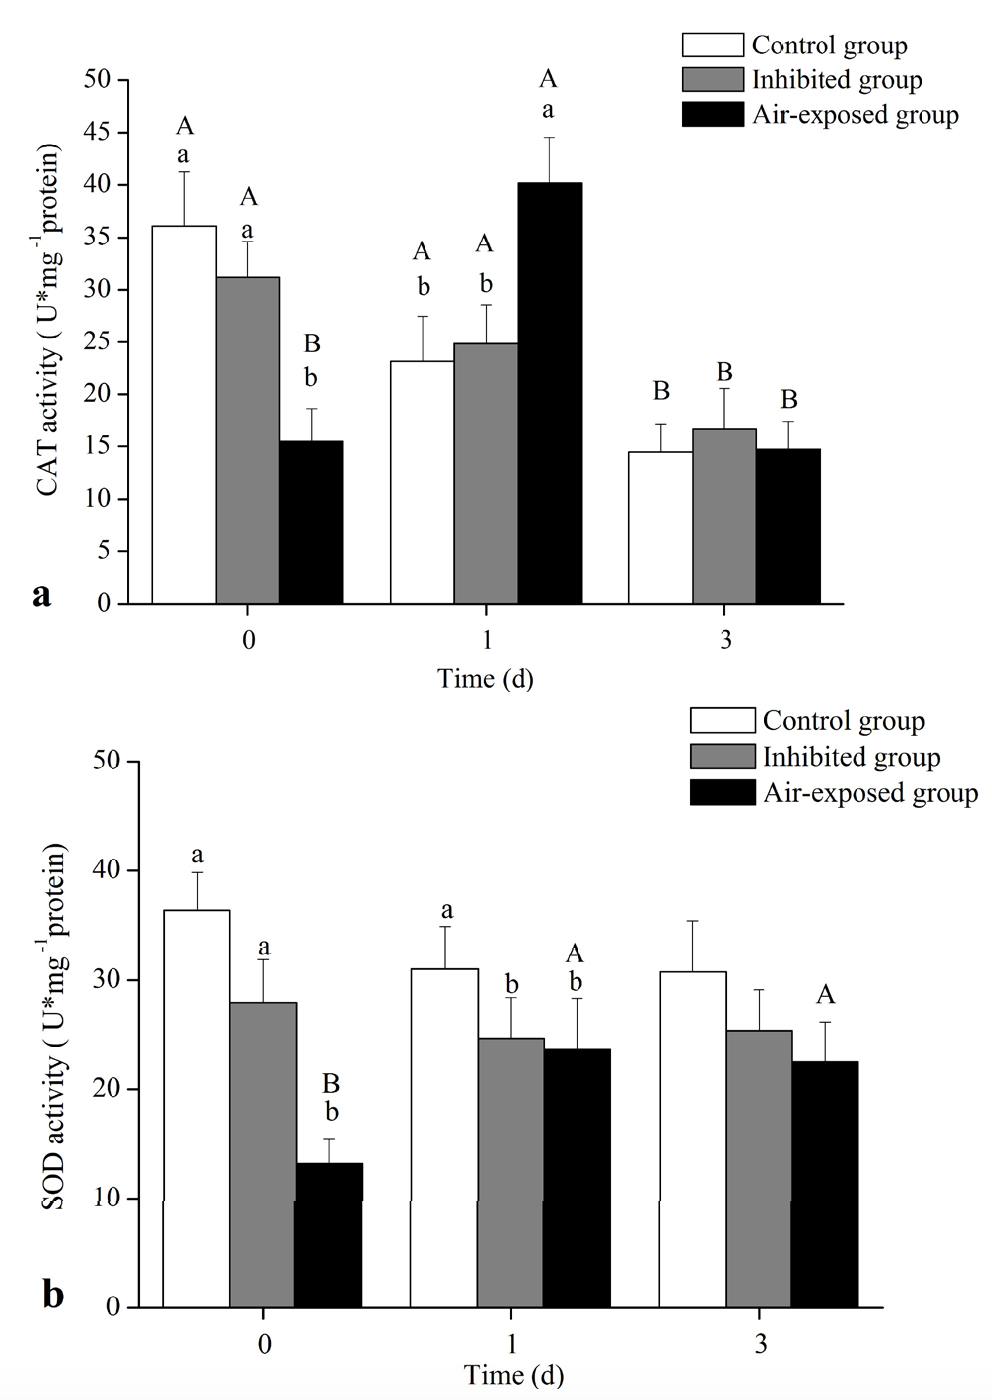
Fig. 3.
Change of antioxidant capability in gill of loach. (a) catalase; (b) superoxide dismutase. Values in the table are represented as Mean ± SD; n=6; different superscripts (lowercase letters) indicate significant differences in different group; different superscripts (capital letters) indicate significant differences in different day; P < 0.05