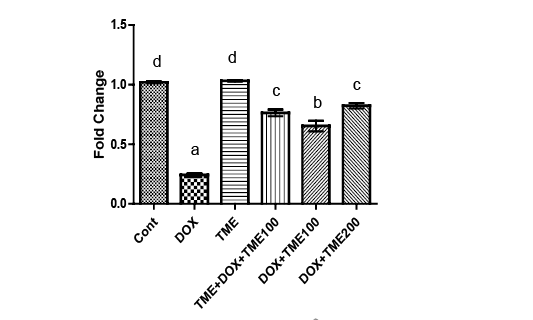
Figure 9
The mRNA expression level of Topoisomerase 2β in Cardiac tissue of rats in control group and under influence of different treatments. The steady-state level of Each bar represents a mean value ±SE and the presence of different letter on the bar means a significant difference between groups of mRNA in the heart were analyzed by RT-PCR assay. Beta actin was used as an invariant internal control for calculating mRNA fold changes. Each bar represents mean value ±SE (n=6). Mean values with different superscript letters are signinifcantly different