
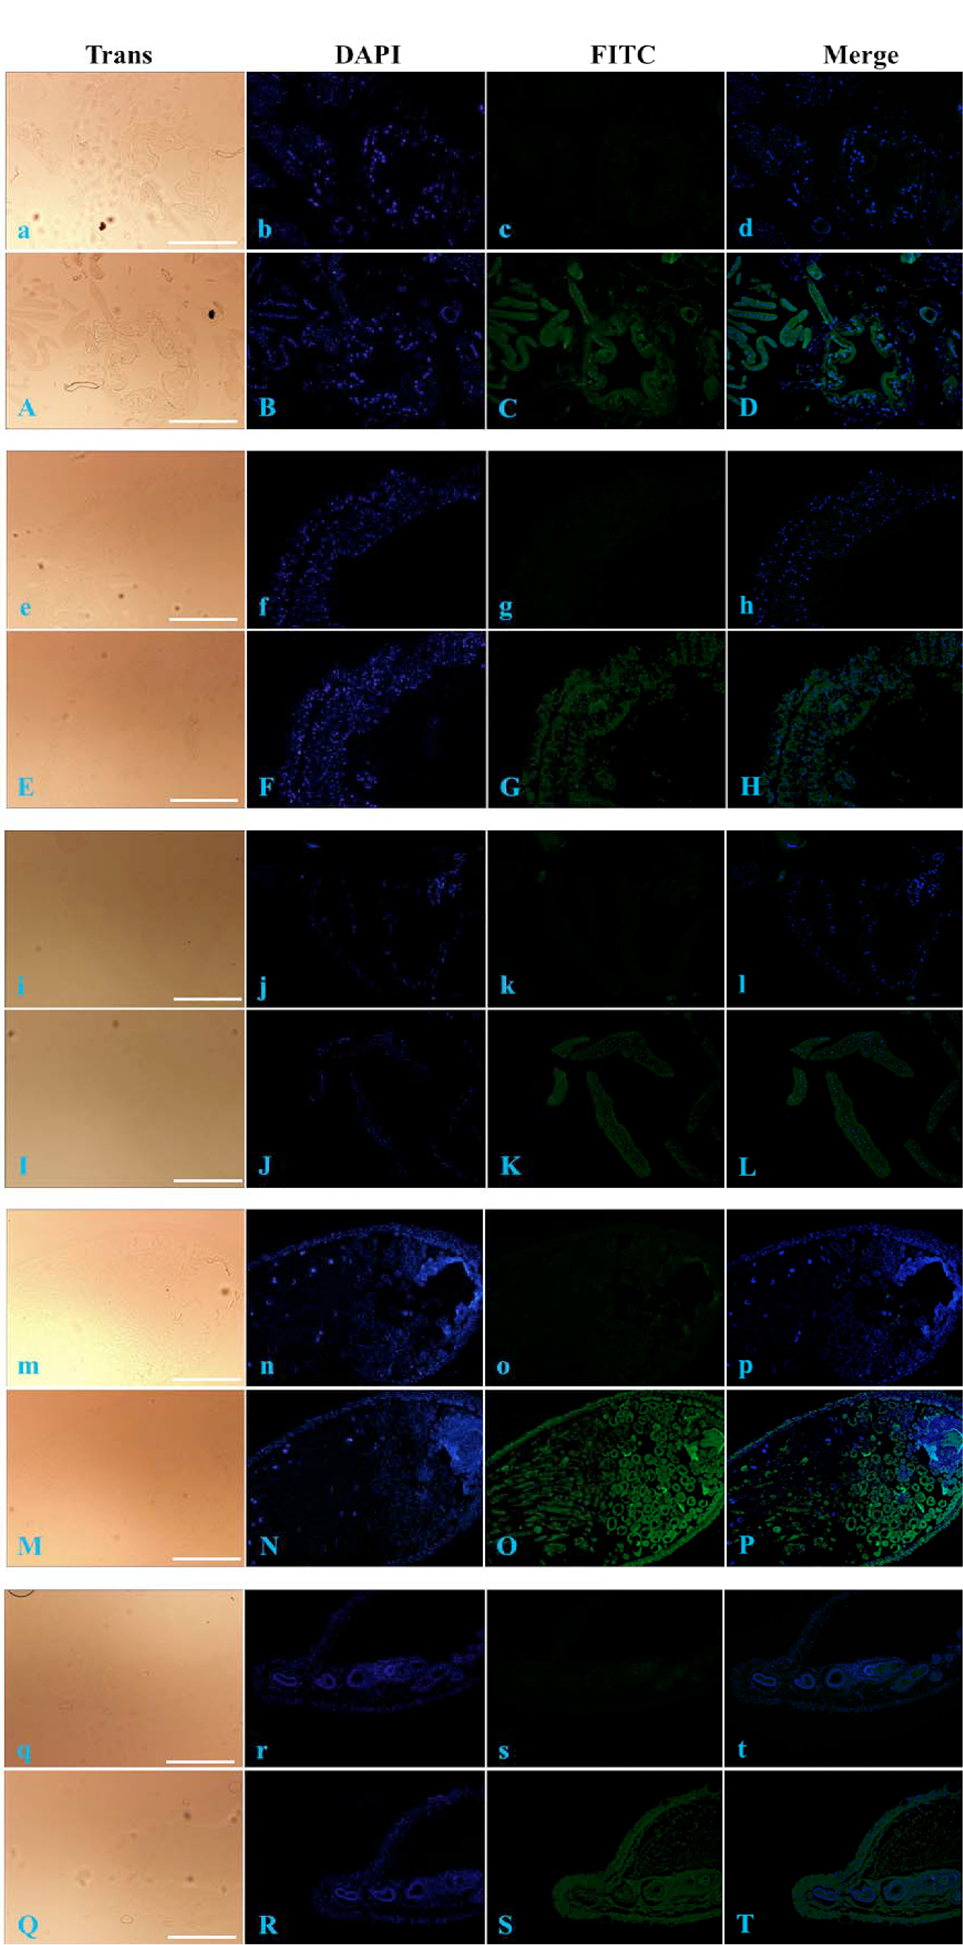
Fig. 6.
Immunofluorescence analysis of BmARM-like protein distribution in different silkworm tissues. a–t, negative controls for A–T, respectively. a–d and A–D, head; e–h and E–H, midgut; i–l and I–L, fat body; m–p and M–P, testis; q–t and Q–T, ovary. Trans (white), optical transmission; DAPI (blue), nuclear staining; FITC (green), BmARM-like protein staining; Merge, merged images for DAPI and FITC. Scale bars = 200 μm.