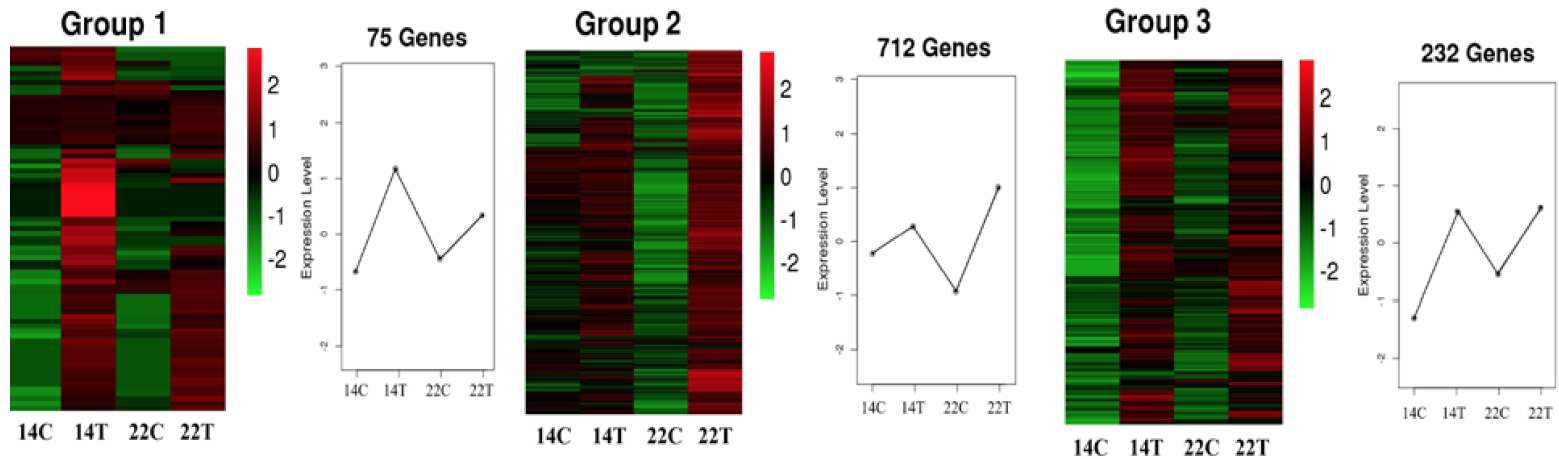
Fig. 3.
The heat map of DEGs in three immune-related clusters. X-axis indicated different samples, and the y-axis indicated the gene expression level. Color key ranging from -2 to 2 represents log2 (FPKM+1), indicating low (green) to high (red) expression.