View larger version:
Download Original File
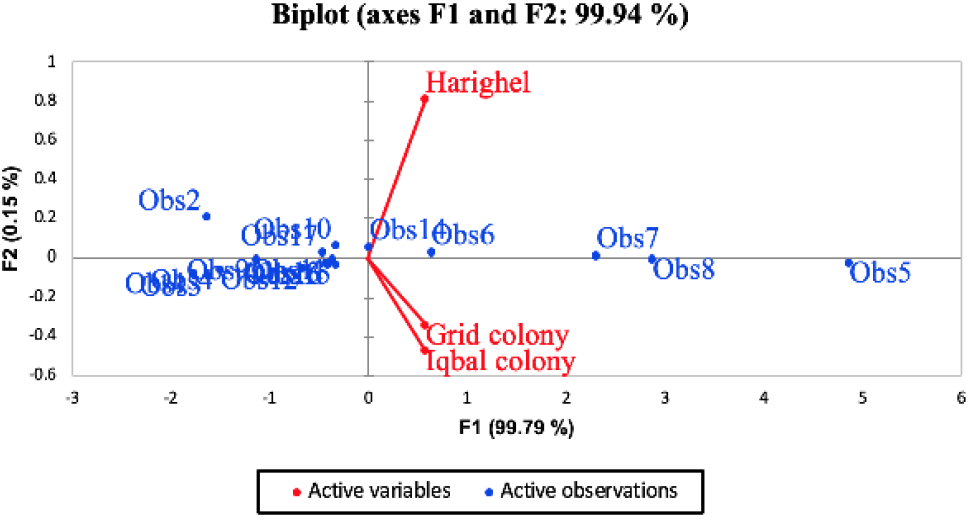
Fig. 2.
PCA plot showing the habitat similarity (observations and site variable).
