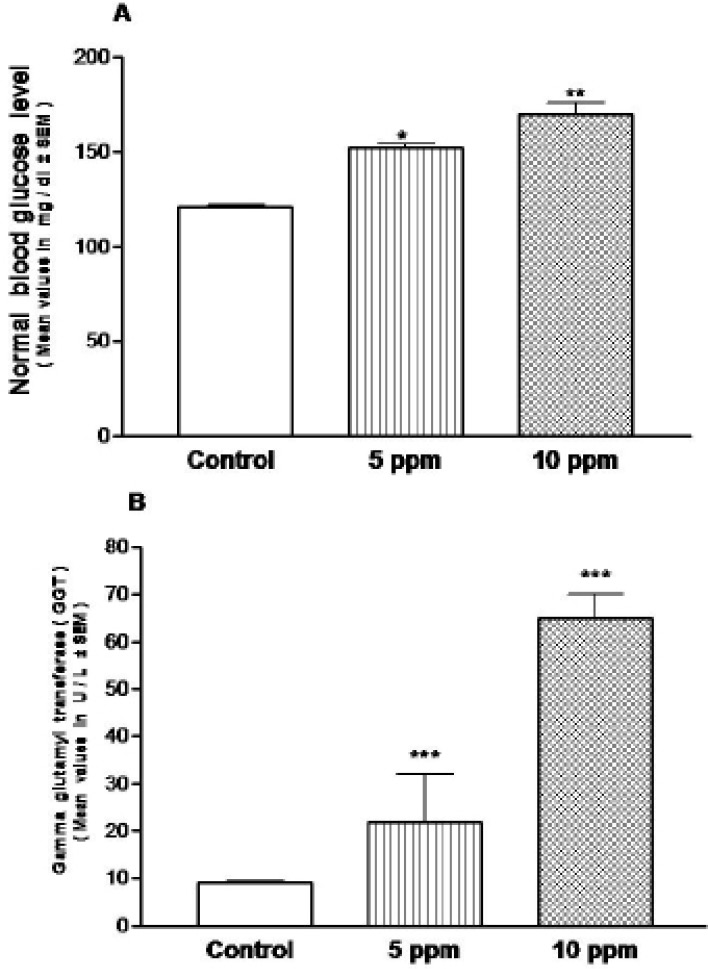
Fig. 4.
Effect of Hg on random glucose level (A), gamma glutamyl transferase (B). *, ** and *** significantly different at (p<0.05, p<0.01 and p<0.001) respectively from the control group by ANOVA student’s t-test.
Effect of Hg on random glucose level (A), gamma glutamyl transferase (B). *, ** and *** significantly different at (p<0.05, p<0.01 and p<0.001) respectively from the control group by ANOVA student’s t-test.