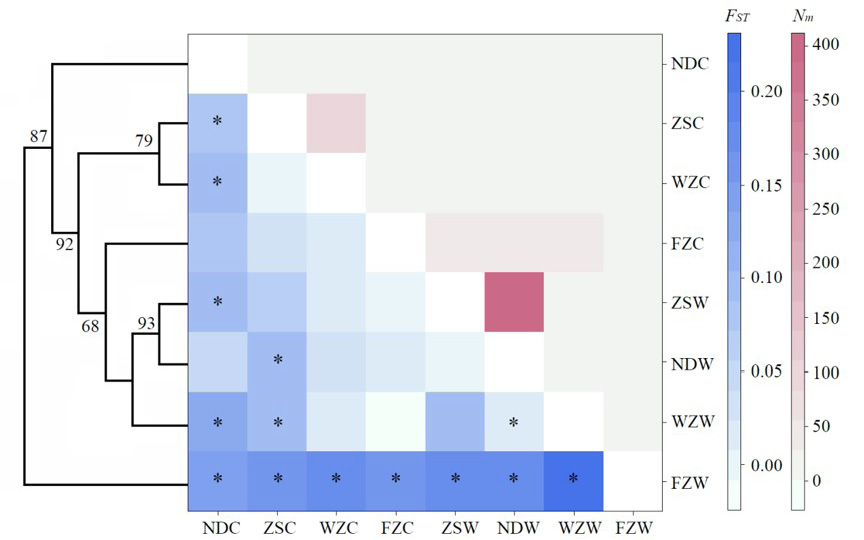
Fig. 3.
Heatmap of FST and Nm with the UPGMA tree for the eight specimens groups. The pairwise FST values ranged from -0.009 to 0.216, and Nm ranged from 1.22 to 384.87.
Heatmap of FST and Nm with the UPGMA tree for the eight specimens groups. The pairwise FST values ranged from -0.009 to 0.216, and Nm ranged from 1.22 to 384.87.