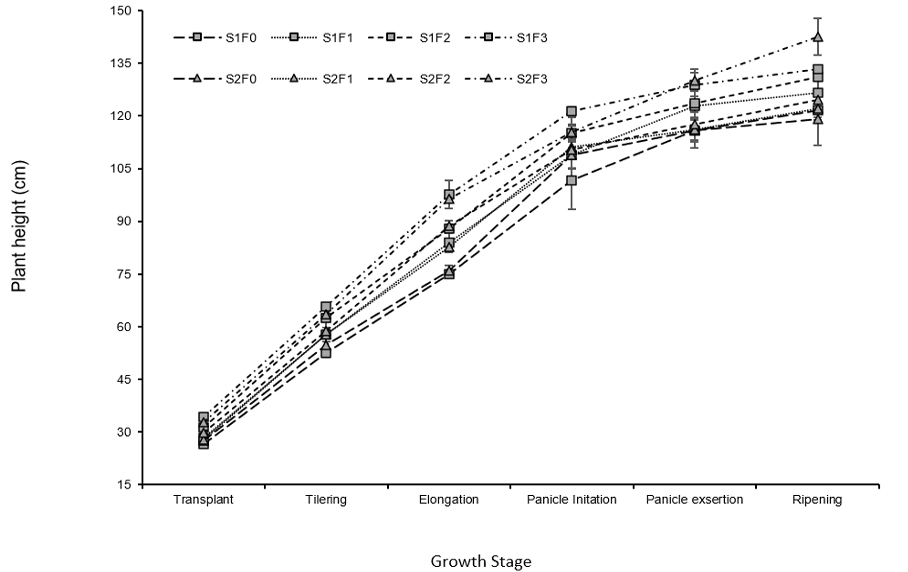
Figure 6:
The dynamics of plant height (a) affected by cropping system and organic fertilizer doses. Error bars represent standard deviation of three samples. S1 = grid, S2 = Jarwo 2:1, F0 = 0 tons ha-1, F3 = 3 tons ha-1, F6 = 6 tons ha-1, F9 = 9 tons ha-1.