Figure 1
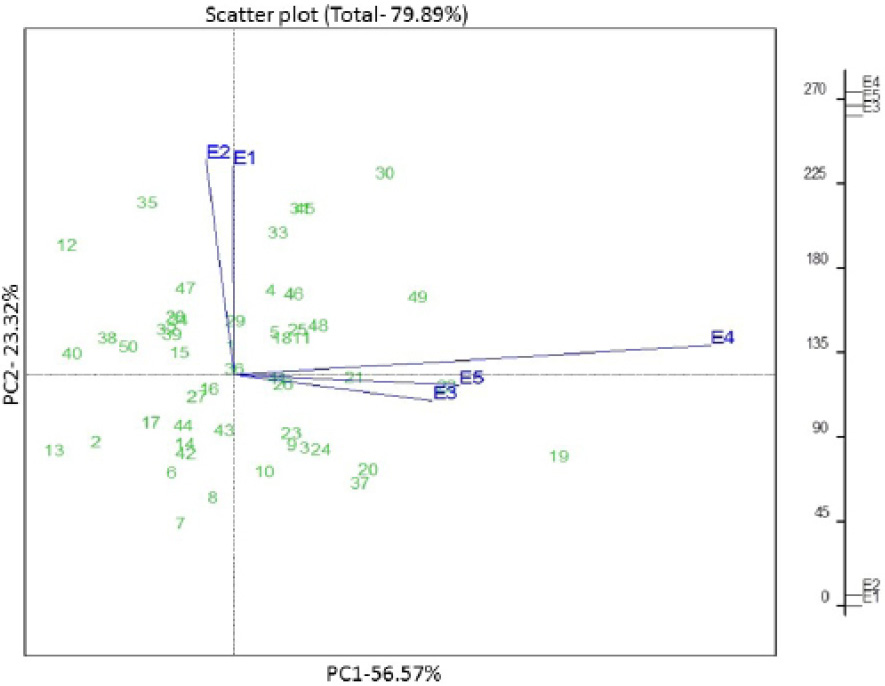
GGE bipot based on mean yield of 50 genotypes of wheat across five environments, 2011/12 and 2012/13. The vectors and rug-plot indicate the relationship among test environments.
GGE bipot based on mean yield of 50 genotypes of wheat across five environments, 2011/12 and 2012/13. The vectors and rug-plot indicate the relationship among test environments.