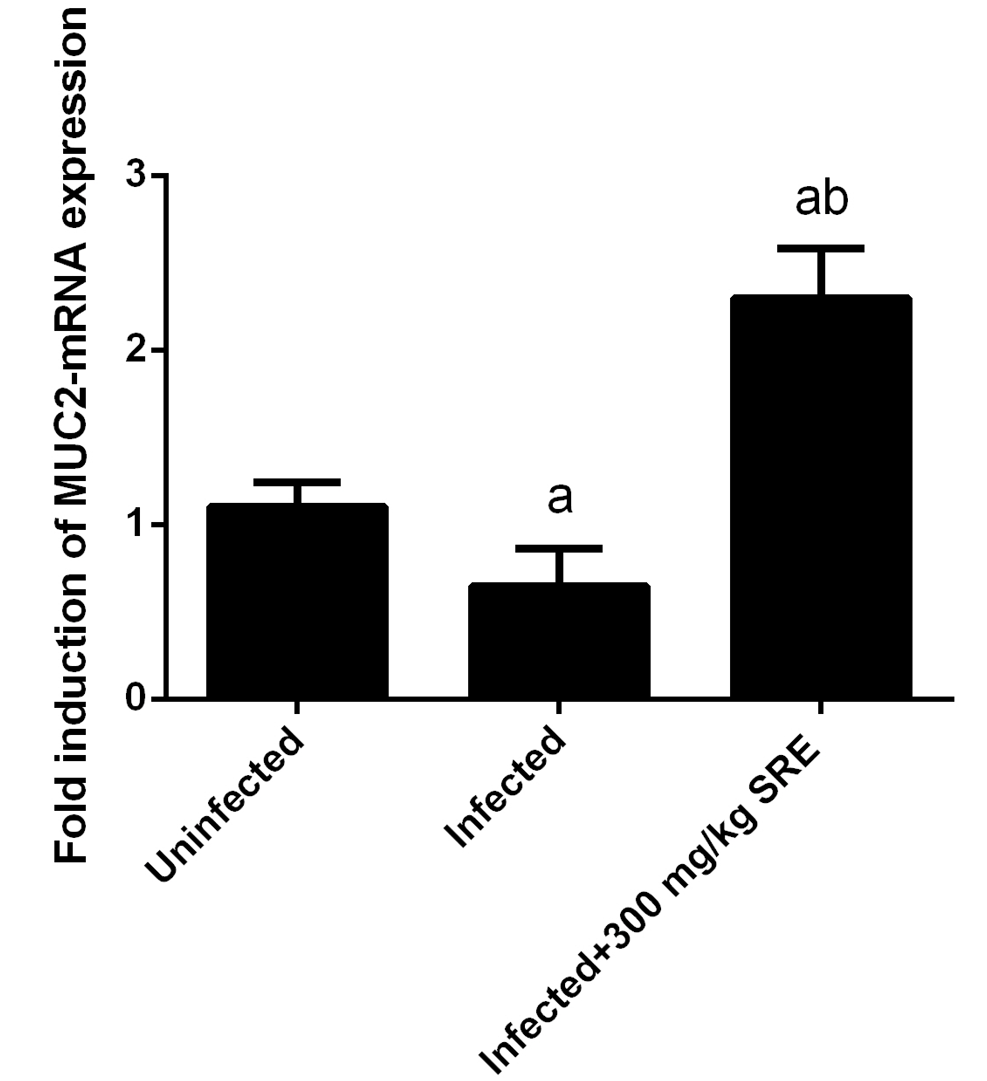
Figure 2
MUC2 gene expression in the jejunum of mice. Expression was normalized to 18S rRNA signals, and relative expression is given as fold increase compared to the non-infected control mice. Values are means±SD. *Significant change at P < 0.01 with respect to infected mice.