Figure 3
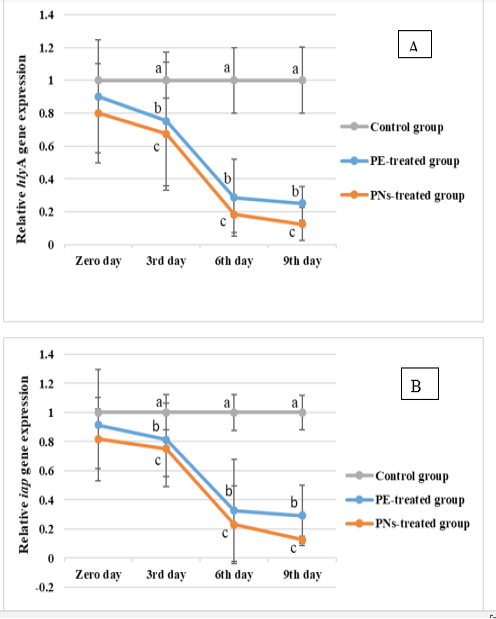
(A). Relative hlyA gene expression of L. monocytogenes in breaded chicken panni treated with PE and PNs groups and control group at chilling preservation. Values are expressed as the mean ±SD. There are significant differences between points that have different letters on the same day of preservation. (B). Relative iap gene expression of L. monocytogenes in breaded chicken panni treated with PE and PNs groups and control group at chilling preservation. Values are expressed as the mean ±SD. There are significant differences between points that have different letters on the same day of preservation.