
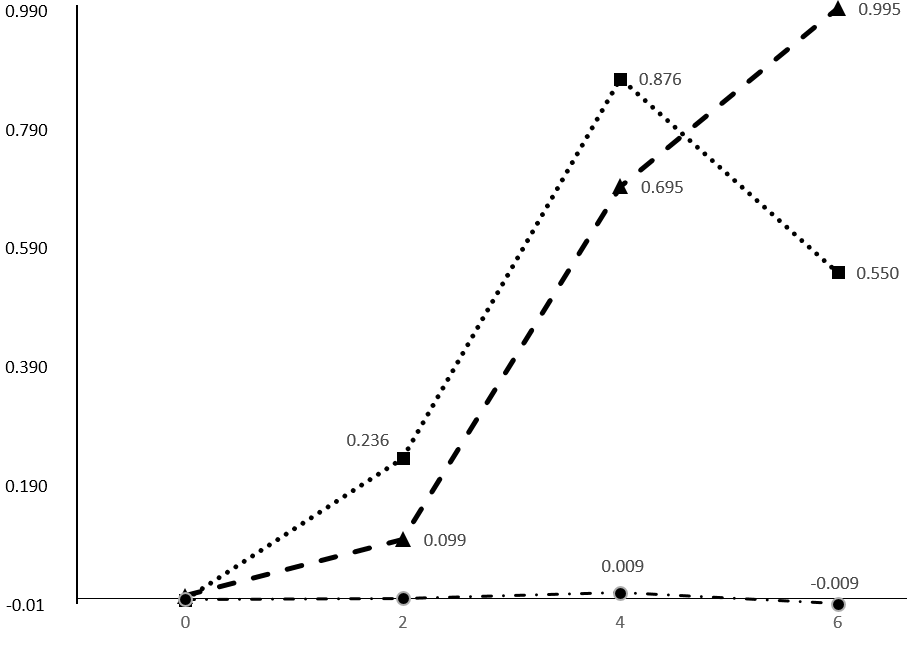
Figure 2
Mean ELISA S/P ratios for anti-IBV antibodies (vertical axis) for SPF chickens vaccinated with vaccine A (triangles), B (squares) and control birds (circles) at weeks 2, 4 and 6 pots-vaccination (horizontal axis). Numbers close to each point are mean S/P values; values at week 0 (prior to vaccination) were 0.005, -0.003 and -0.001 for vaccines A, B and C, respectively, and are not shown on the graph due to their proximity.