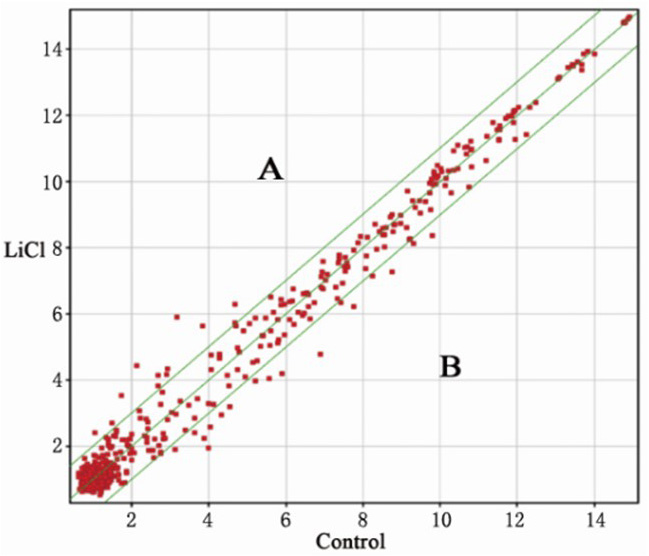
Fig. 4.
The spot falling on graph y=x line (the median line on the graph) represents the probe point signal values differences in the two chips (fold change=1). Graph points fall on both sides of the bit line, which is outside the 45° line, representing the difference between the value of the probe signal point in the two chips (fold change >2). An area: 2x increased microRNAs (miRNAs); B area: 2x decreased miRNAs.
