
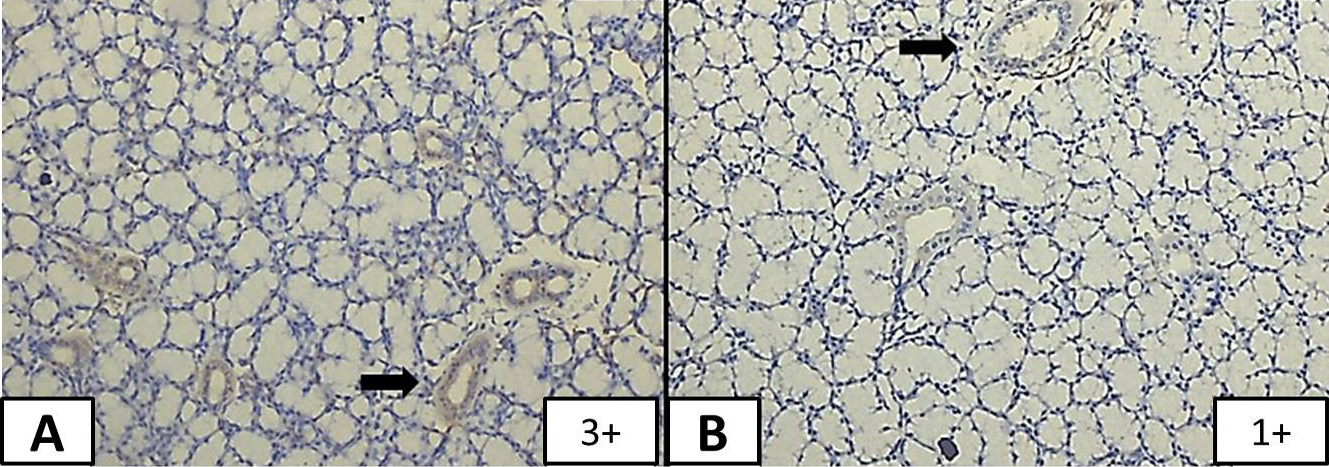
Fig. 1.
TGF-α expression in SLG: A, longitudinal section of ductal epithelial cells of SLG of group A1 showing TGF-α intensity score of positive (3+) under 10 x magnifications; B, Ductal epithelial cells of SLG of group A2 with TGF-α intensity score of minimally positive (1+) under 10x magnification. Black arrows marks striated ducts.