View larger version:
Download Original File
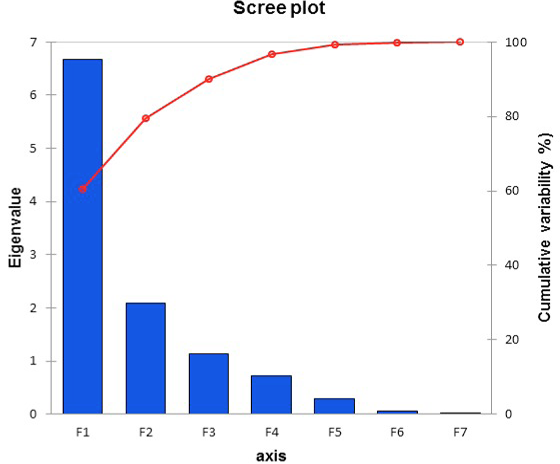
Fig. 1.
PCA plot showing eigenvalues.