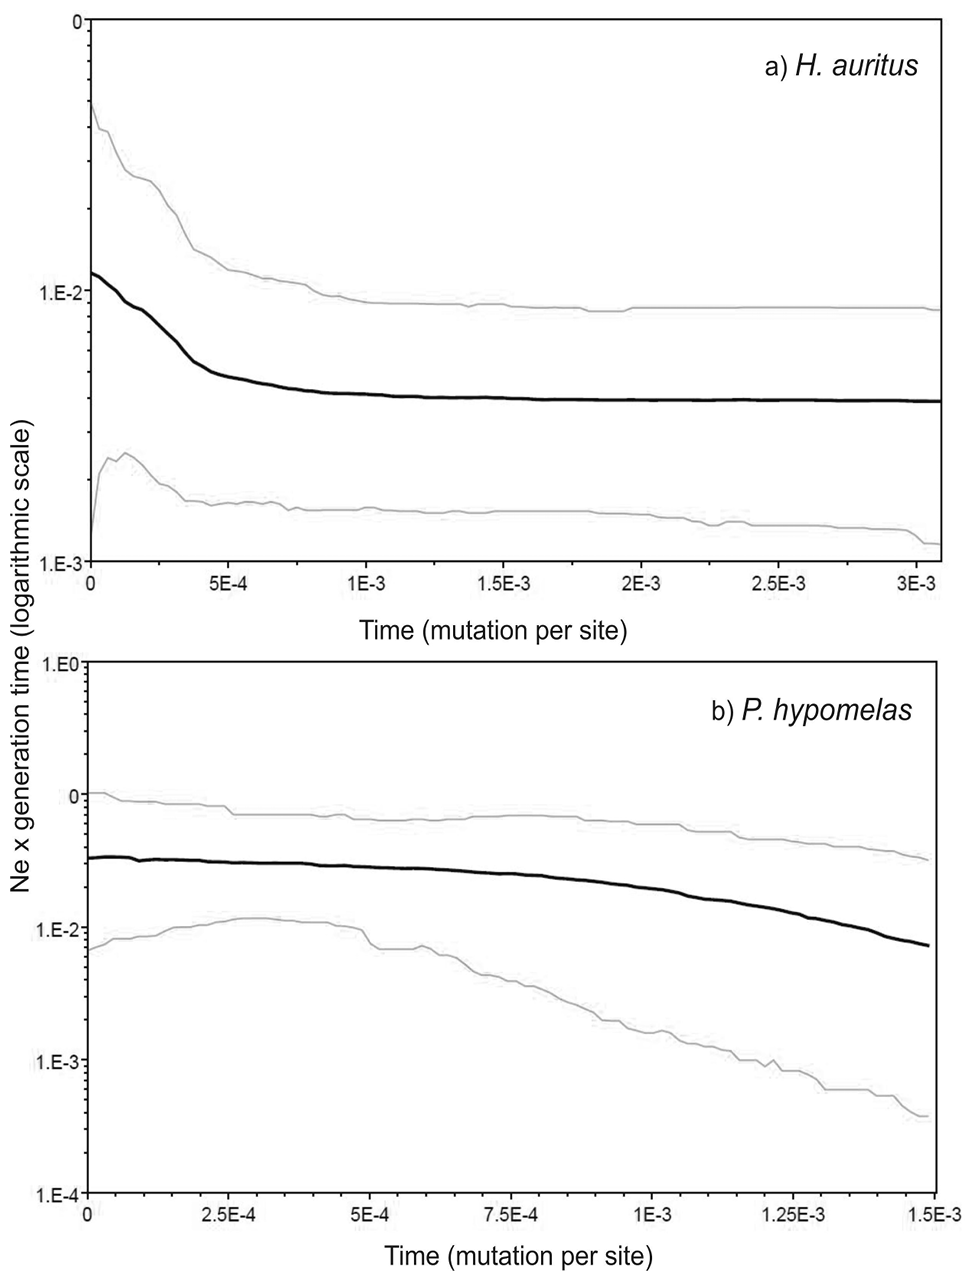
Fig. 5.
Bayesian skyline plots showing changes in effective population size based on partial sequences of cytochrome b for H. auritus (a) and P. hypomelas (b). The Black lines depicts the mean Ne estimation and the blue lines represents the highest 95 % posterior intervals.