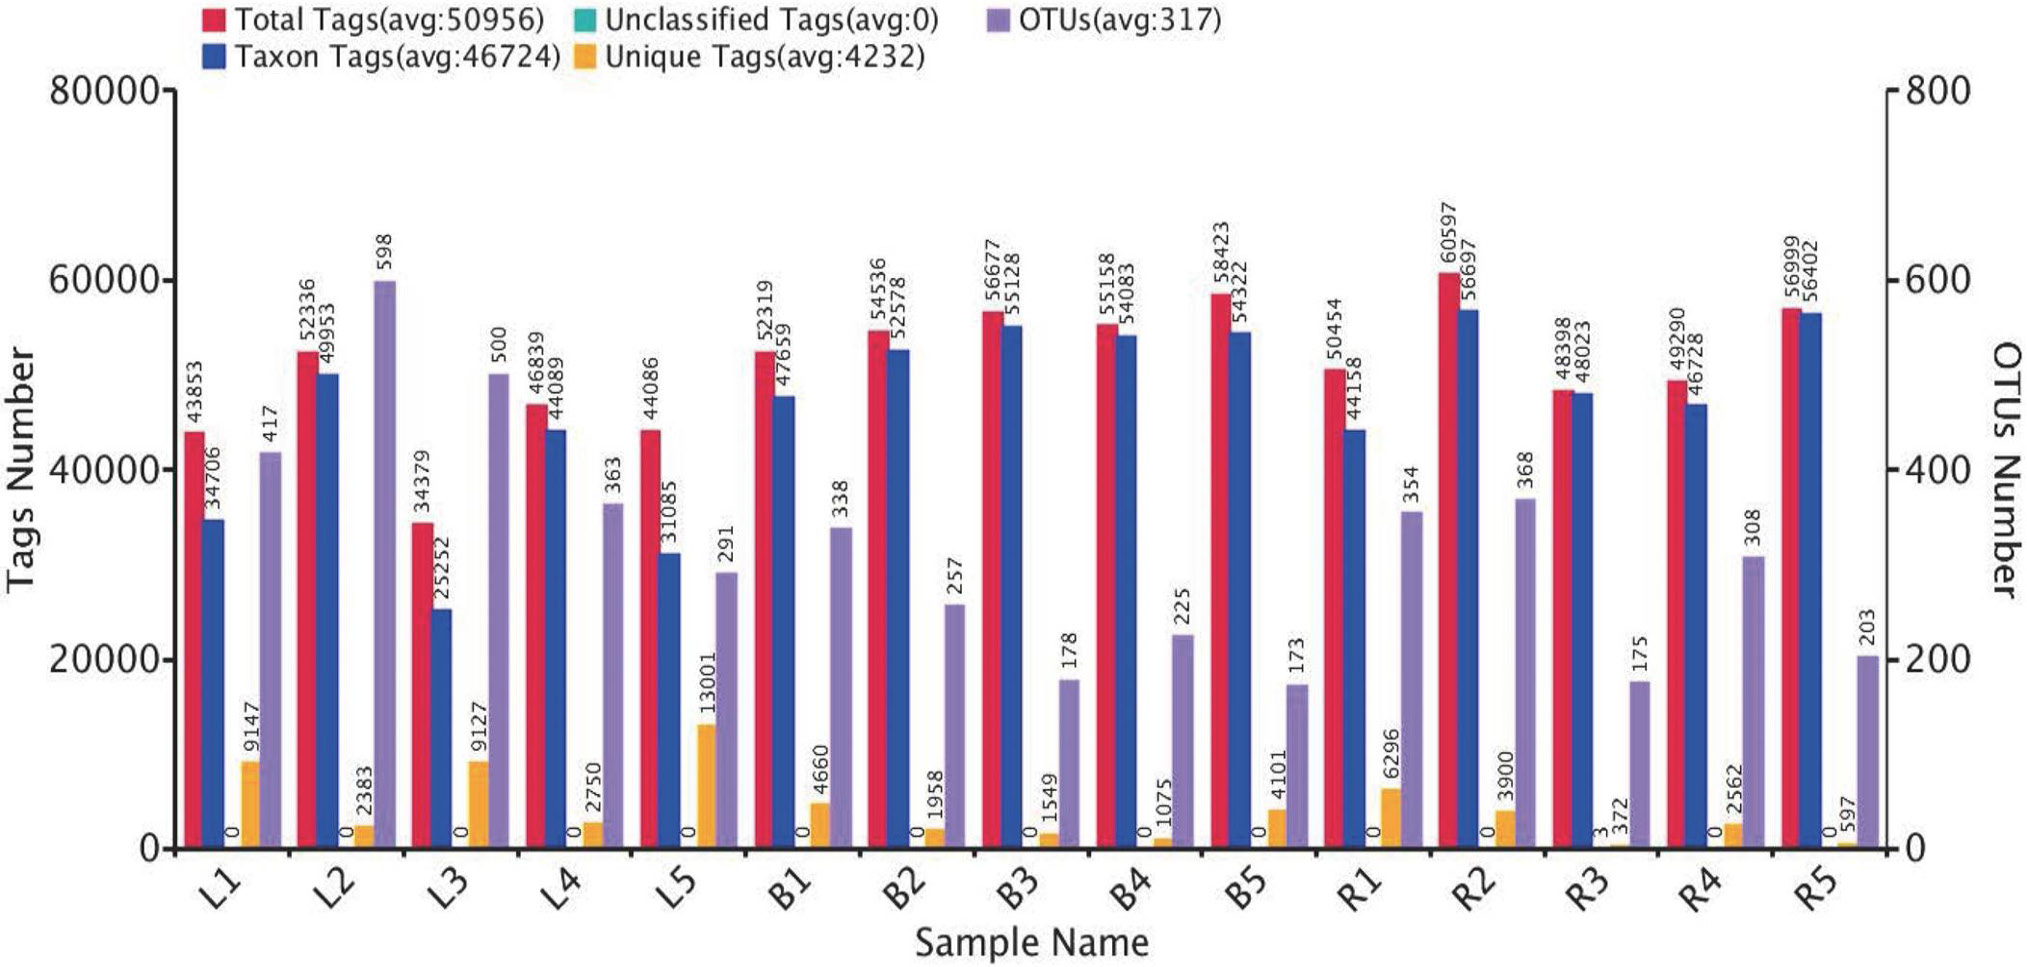
Fig. 1.
The OTU clustering of each sample. The red bars represent the numbers of effective tags of OTU clusters in each sample; the orange bars (Unique Tags) show the number of tags that could not be clustered to the OTUs; the blue bars (Taxon Tags) show the number of tags clustered to the OTUs that had the annotation information in each sample; the purple bars (OTUs) represent the number of OTUs obtained from each sample. L1~5, B1~5, and R1~5 represent 5 biological replicates at egg-laying, broody and recovery stages, respectively.