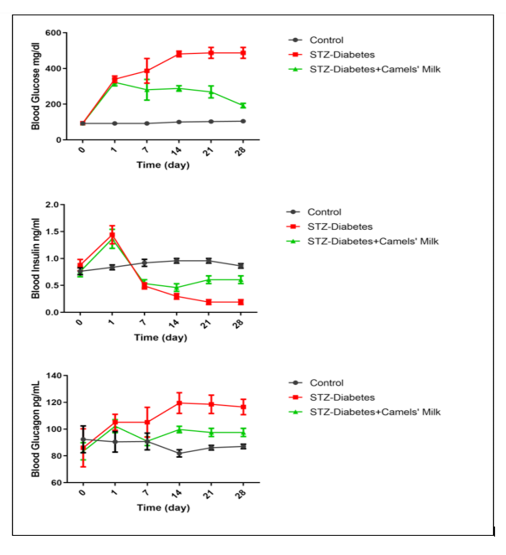
Figure 7
Curves represent blood glucose, insulin, and glucagon levels during the experiment. Glucose;Interaction:F(10,60)=9.97,P<0.0001,Time:F(5,60)=22.65,P<0.0001,andTreatment:F(2,12)=187.49,P<0.0001,Insulin;Interaction:F(10,75)=16.27,P<0.0001,Time:F(5,75)=38.25, P<0.0001, and Treatmentent:F(2,15)=7.96,P=0.0044,andGlucagon,Interaction:F(10,60)=3.52,P=0.0011,Time:F(5,60)=4.08,P=0.0030,andTreatment:F(2,12)=3.71,P=0.0558, respectively (two-way ANOVA) and Bonferroni posttests. N=10.