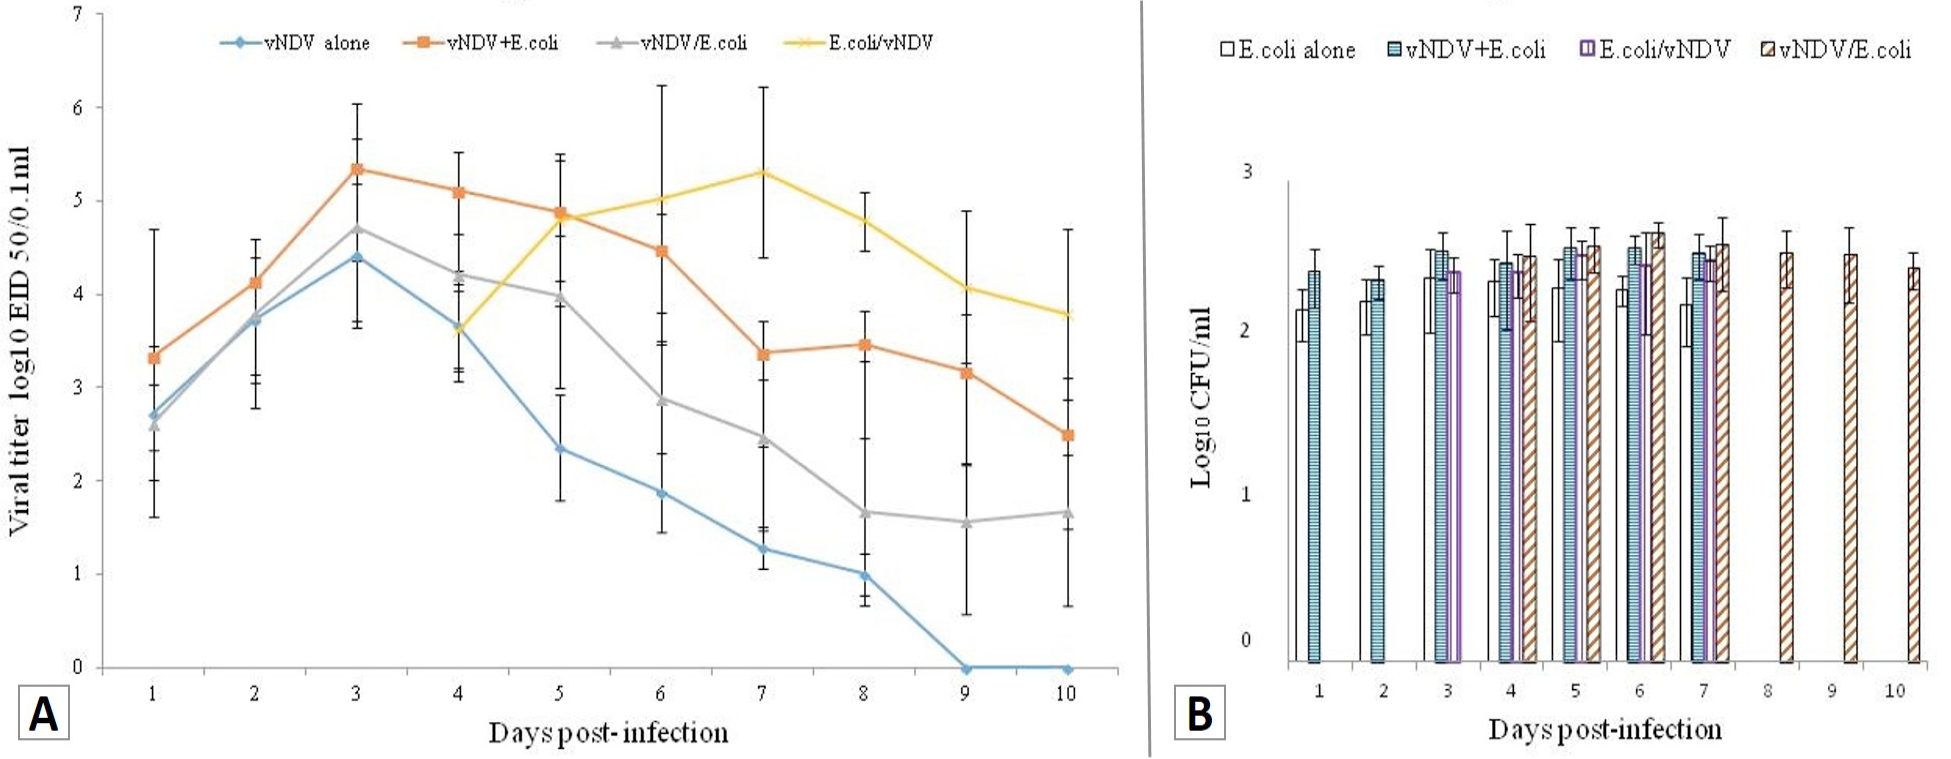
Fig. 5.
Virus and bacteria shedding pattern in oropharnygeal swabs in different co-infected groups (A) and virus shedding in oropharnygeal swabs collected at different time points after vNDV inoculation (B) E. coli (O78) titres (Log10 CFU/mL) in oropharnygeal swabs collected at different time points after E. coli (O78) inoculation.