
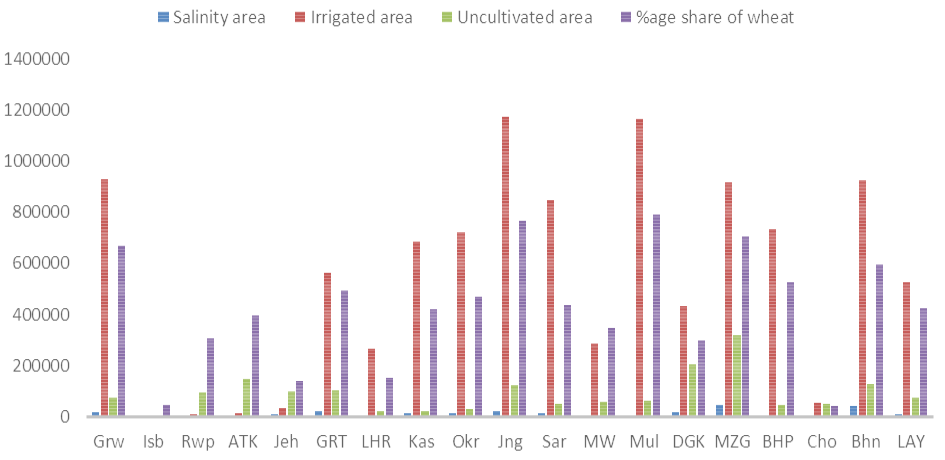
Figure 3:
District wise distribution of salinity in relation to uncultivated area, irrigated area and wheat share during 1990.
District wise distribution of salinity in relation to uncultivated area, irrigated area and wheat share during 1990.