
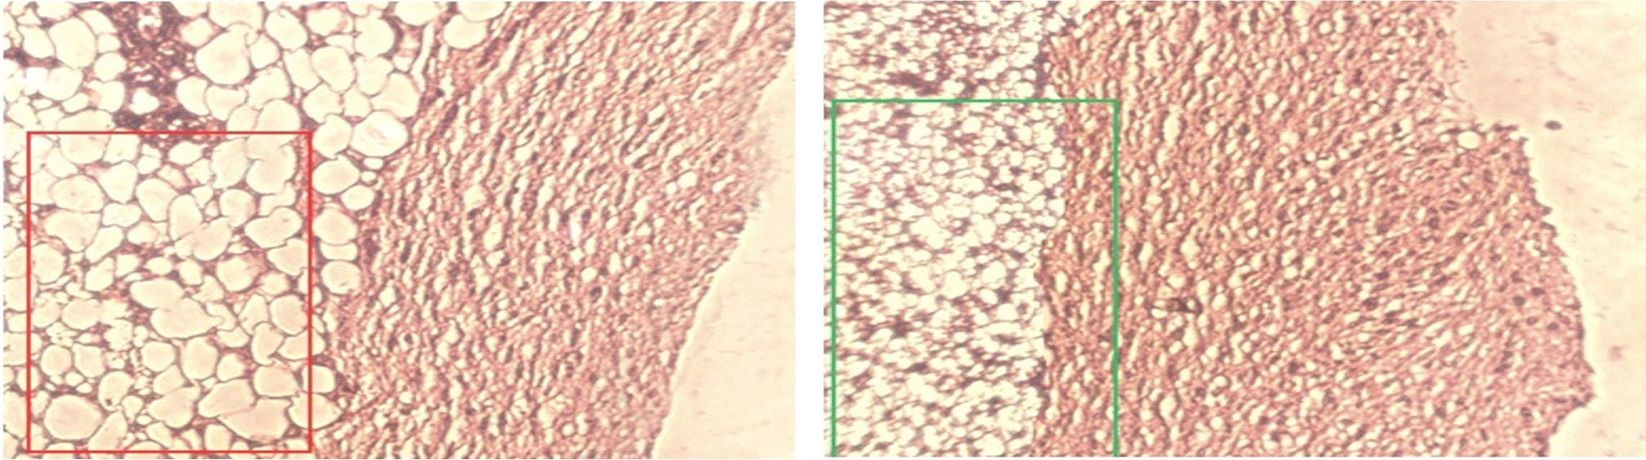
Fig. 8.
Cross section of skin tissue of non-lactating female control mouse (left) and test (right). H & E stain: 1000x magnification. Red square indicate the larger and more adipocytes in hypodermal layer.Green square indicate the smaller size of adipocutes in hypodermal layer, under the influence of exogenous bPL with lesser fat content.