View larger version:
Download Original File
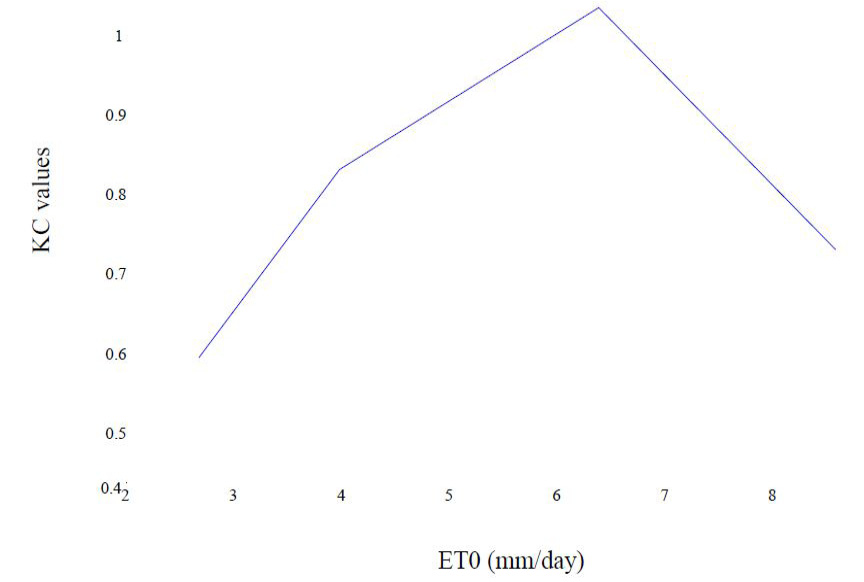
Figure 2
Chart between ETo and Kc values at different stages.