
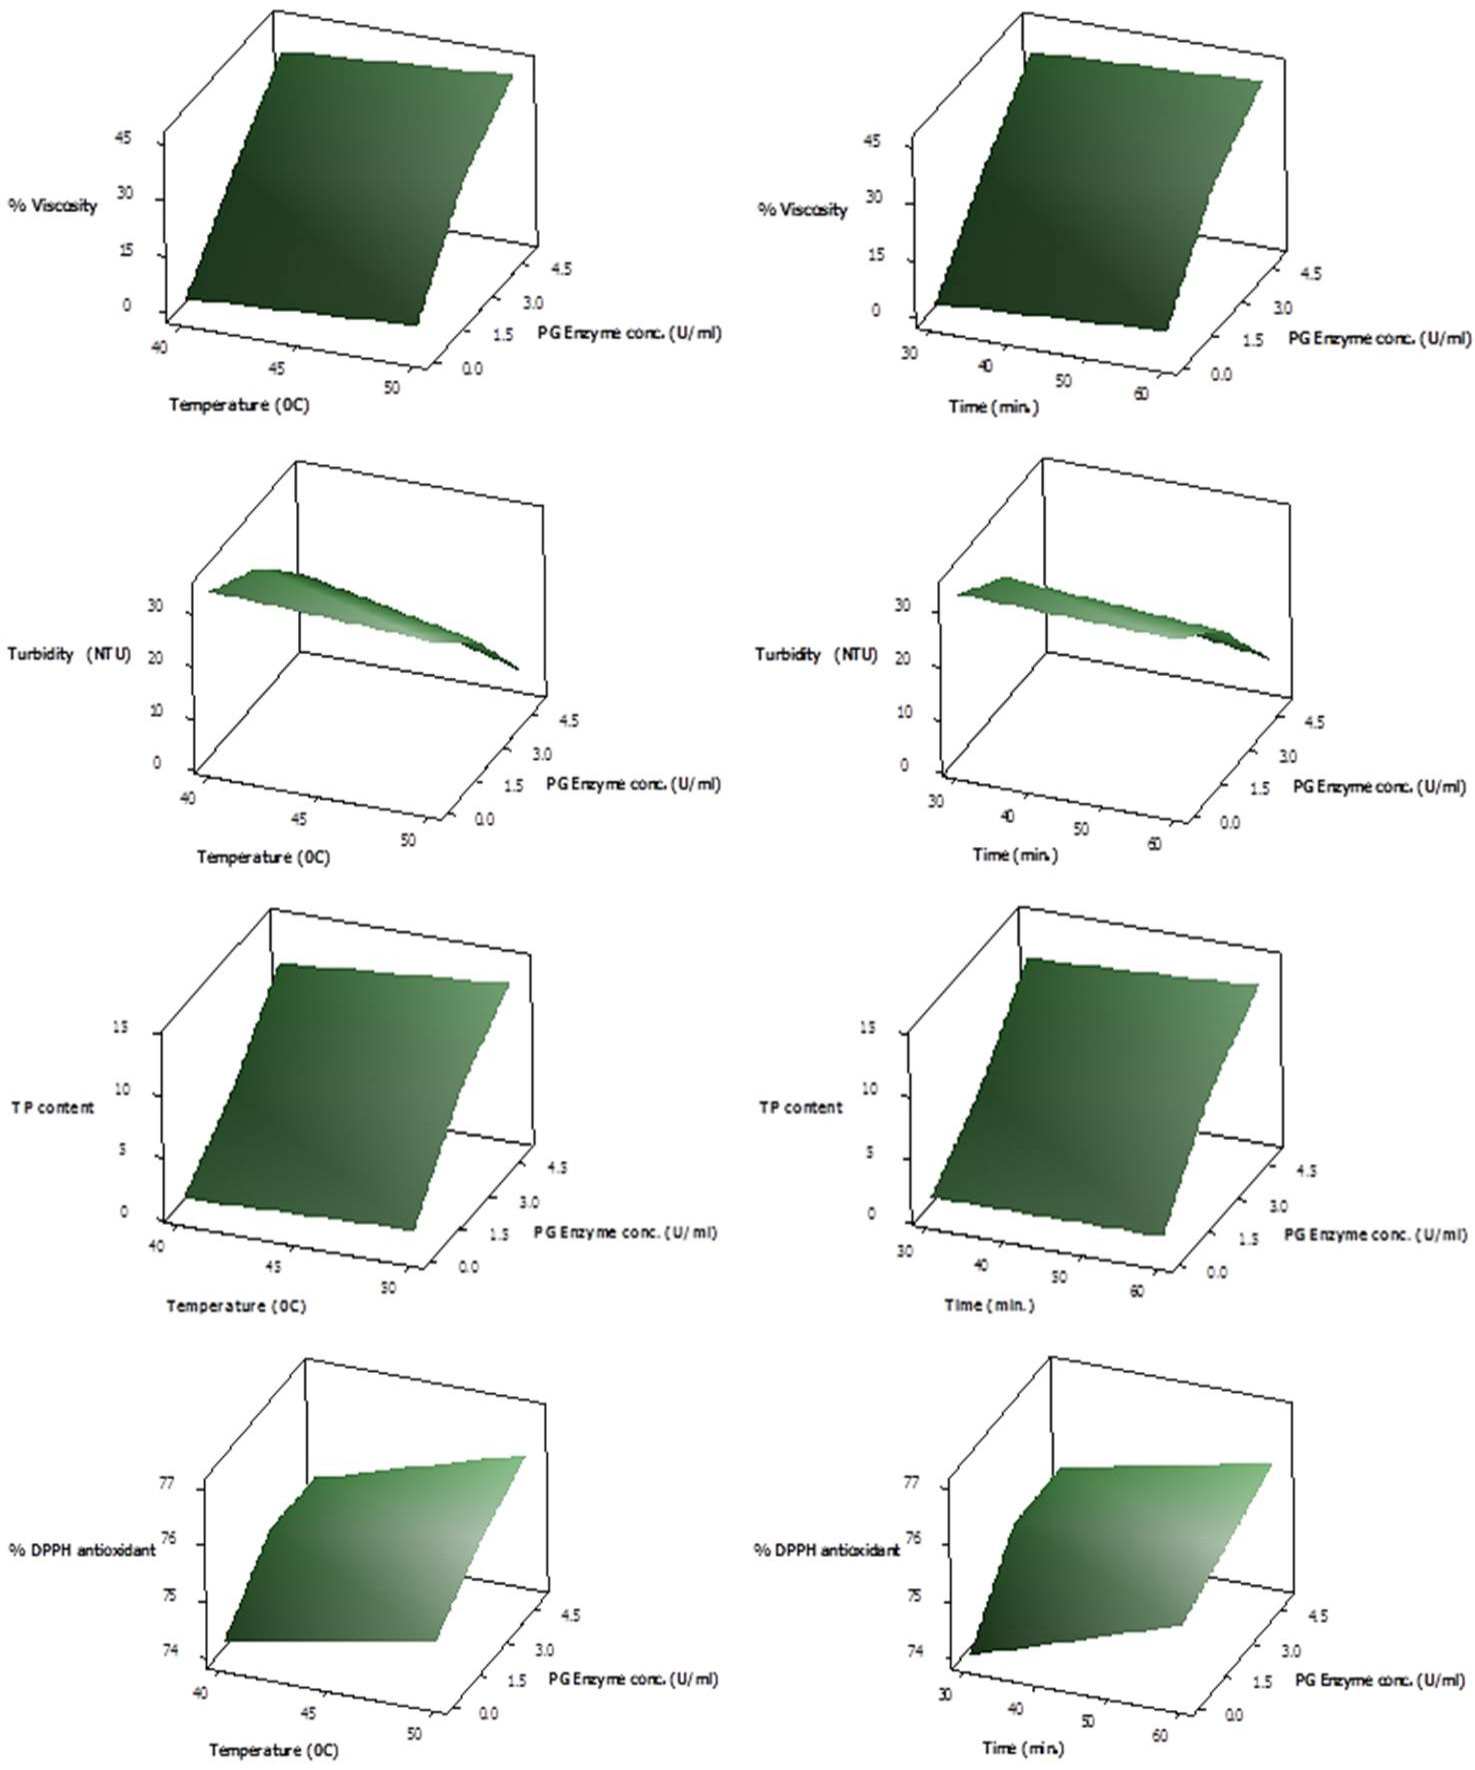
Fig. 11.
Response Surface plots showing interactive effect of temperature (left panel) and time (right panel) on % viscosity reduction, turbidity, total phenolic content and % DPPH antioxidant activity of juice employing various PG enzyme concentrations.