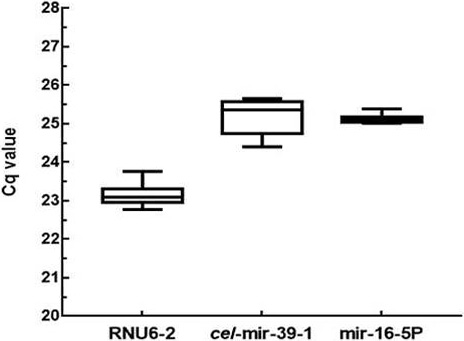
Fig. 1.
Comparison of quantitative real time PCR for RNU6-2, cel-mir-39-1 and mir-16-5p as reference genes determined through qPCR. Boxes represent mean and standard deviation and whiskers represent minimum and maximum values.
Comparison of quantitative real time PCR for RNU6-2, cel-mir-39-1 and mir-16-5p as reference genes determined through qPCR. Boxes represent mean and standard deviation and whiskers represent minimum and maximum values.