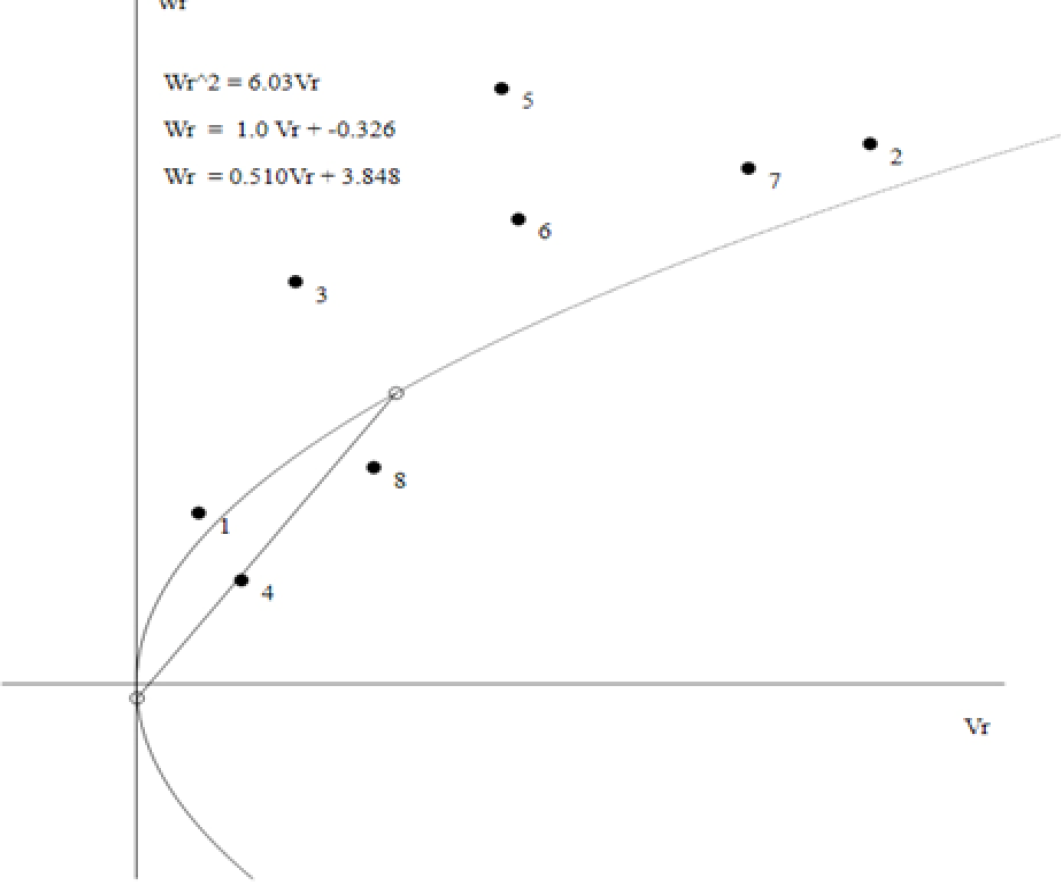
Figure 1
The Vr/Wr graph regarding days to maturity explaining type of dominance and genotypes with dominant and recessive genes
1=FS; 2= BST; 3= SRN; 4= PS; 5= S2K; 6= AUP; 7= TTR; 8= JNB