
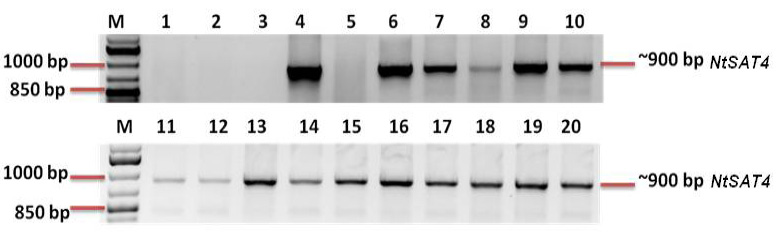
Figure 2
Genomic PCR characterization of the putative transformed NtSAT4 overexpression lines; PCR result (0.9 Kb) using genomic DNA against NtSAT4 gene specific primers. Lane M: DNA ladder 1kb plus; Lanes 1,2,3: wild-type B. napus as negative control; Lane 4: positive control; Lanes 5-20: examples of putatively transformed plants with the cytosolic; plastidic and mitochondrial NtSAT4 constructs.