Figure 4
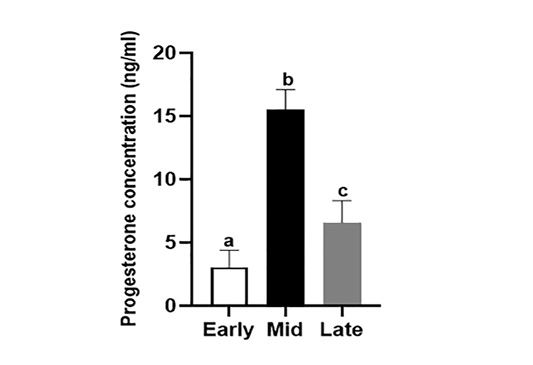
Estimation of progesterone levels during different stages of CL. Bars are presented as mean±SEM. a,b,cStatistical differences between different stages of CL (statistical significant at P<0.001).
Estimation of progesterone levels during different stages of CL. Bars are presented as mean±SEM. a,b,cStatistical differences between different stages of CL (statistical significant at P<0.001).