
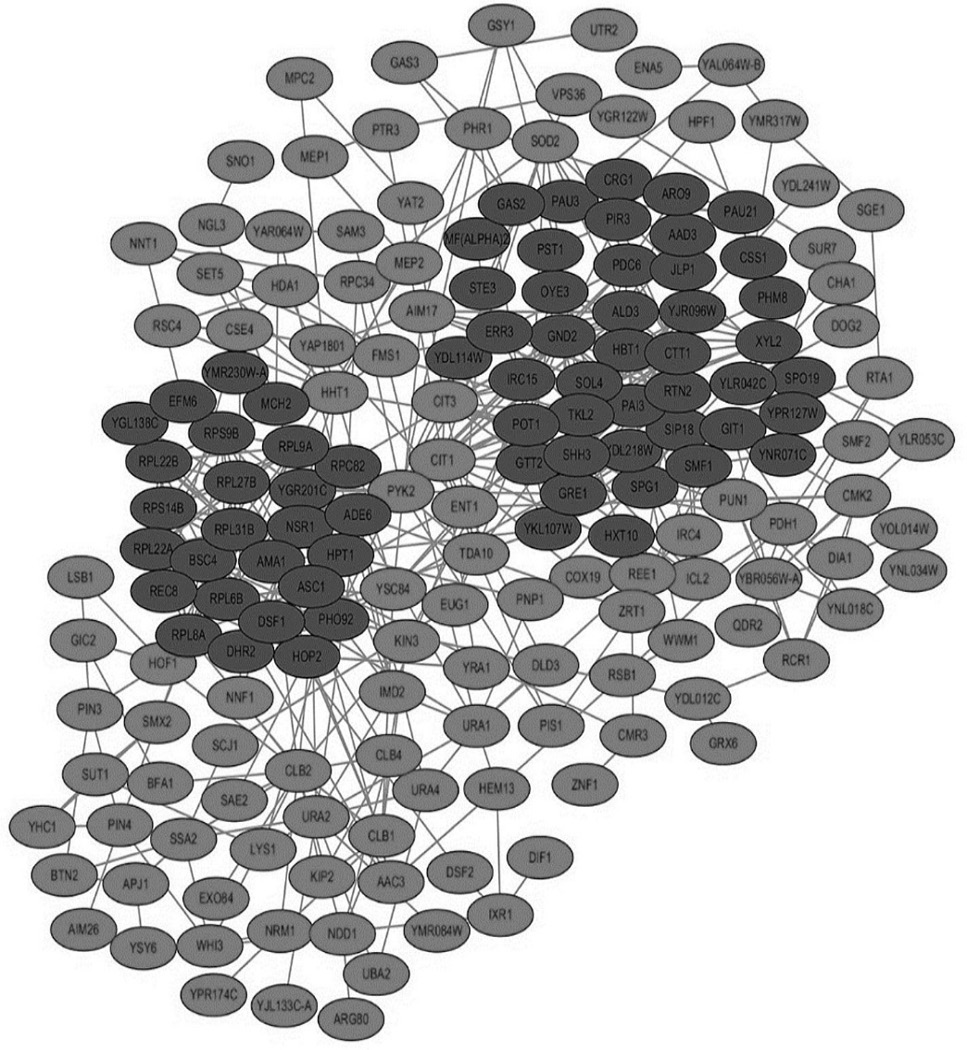
Fig. 3.
Protein-protein interaction network diagram. Red indicates the up-regulated gene and green indicates the down-regulated gene.
Protein-protein interaction network diagram. Red indicates the up-regulated gene and green indicates the down-regulated gene.