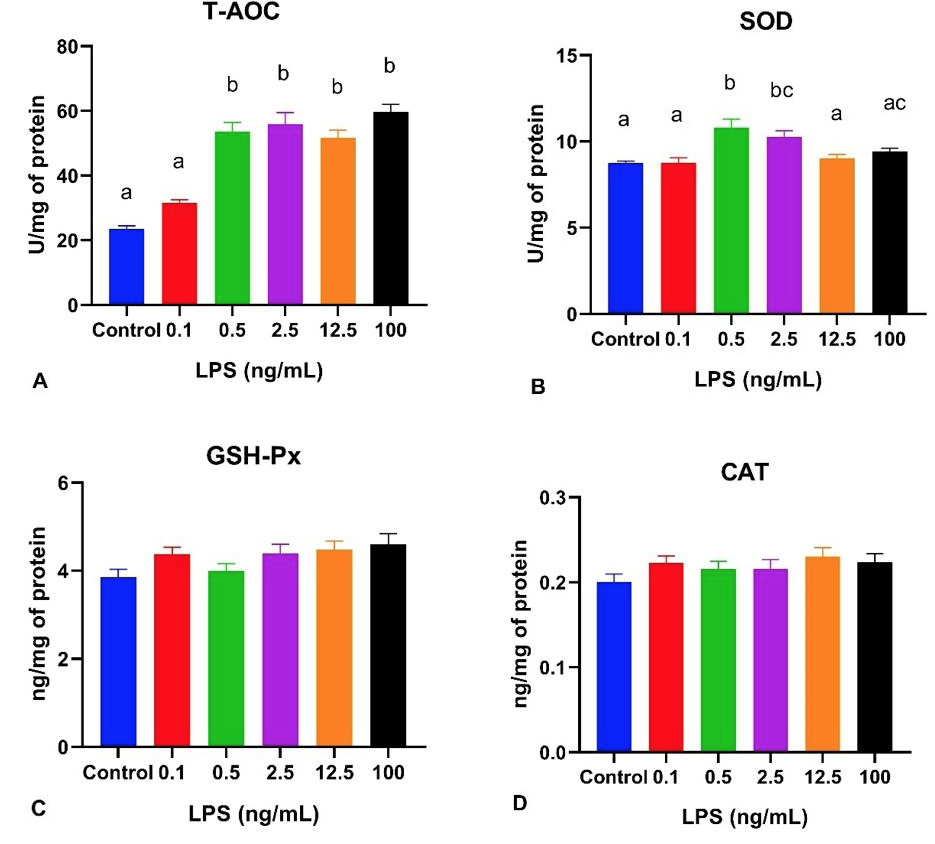
Fig. 4.
Effects of different LPS levels on the activities of antioxidants in MAC-T cells. Columns without a common lowercase letter (a, b, c) indicate significant difference among treatments (P < 0.05). T-AOC, total antioxidant capacity; GSH-Px, glutathione peroxidase; CAT, catalase; SOD, superoxide dismutase.