
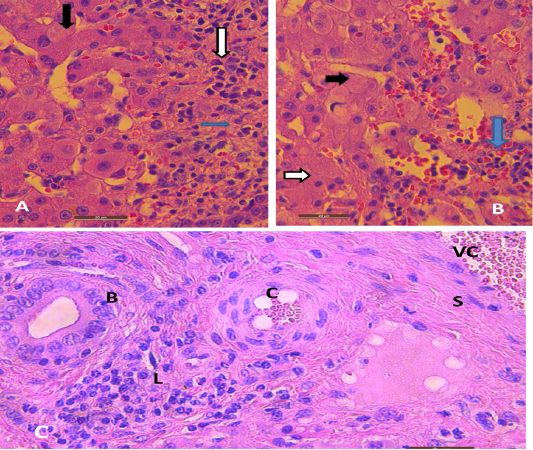
Figure 6
Liver of mice infected with hydatid cysts stained by hematoxylin-eosin. (A) Section depicts vacuolated hepatic cells expressing hydrophobic change (black arrow), necrosis (blue arrow), and Chronic infiltration of inflammatory cells (lymphocytes) (white arrow). (B) It shows vacuolation as reversible injury in hepatocytes (black arrow), necrosis (white arrow) and hemorrhage (blue arrow). (C) Illustrates bile duct (B), infiltration of lymphocytes(L), spindle shape fibroblasts (S), and vascular congestion (VC). A and B. Scale bar= 20µm, C. Scale bar= 2µm.