View larger version:
Download Original File
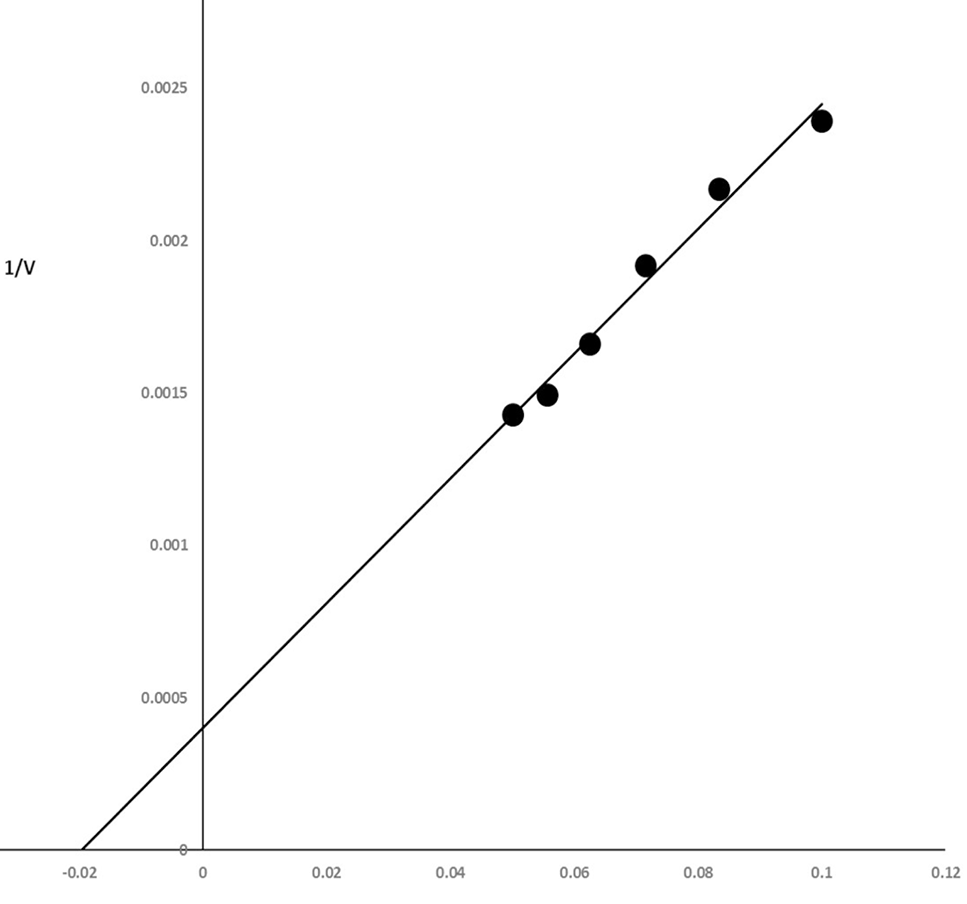
Fig 5
Lineweaver-Burk plot. X axis shows the values for 1/substrate while Y axis shows the values for 1/V
0.
The plot was utilized to calculate the kinetic parameters.
