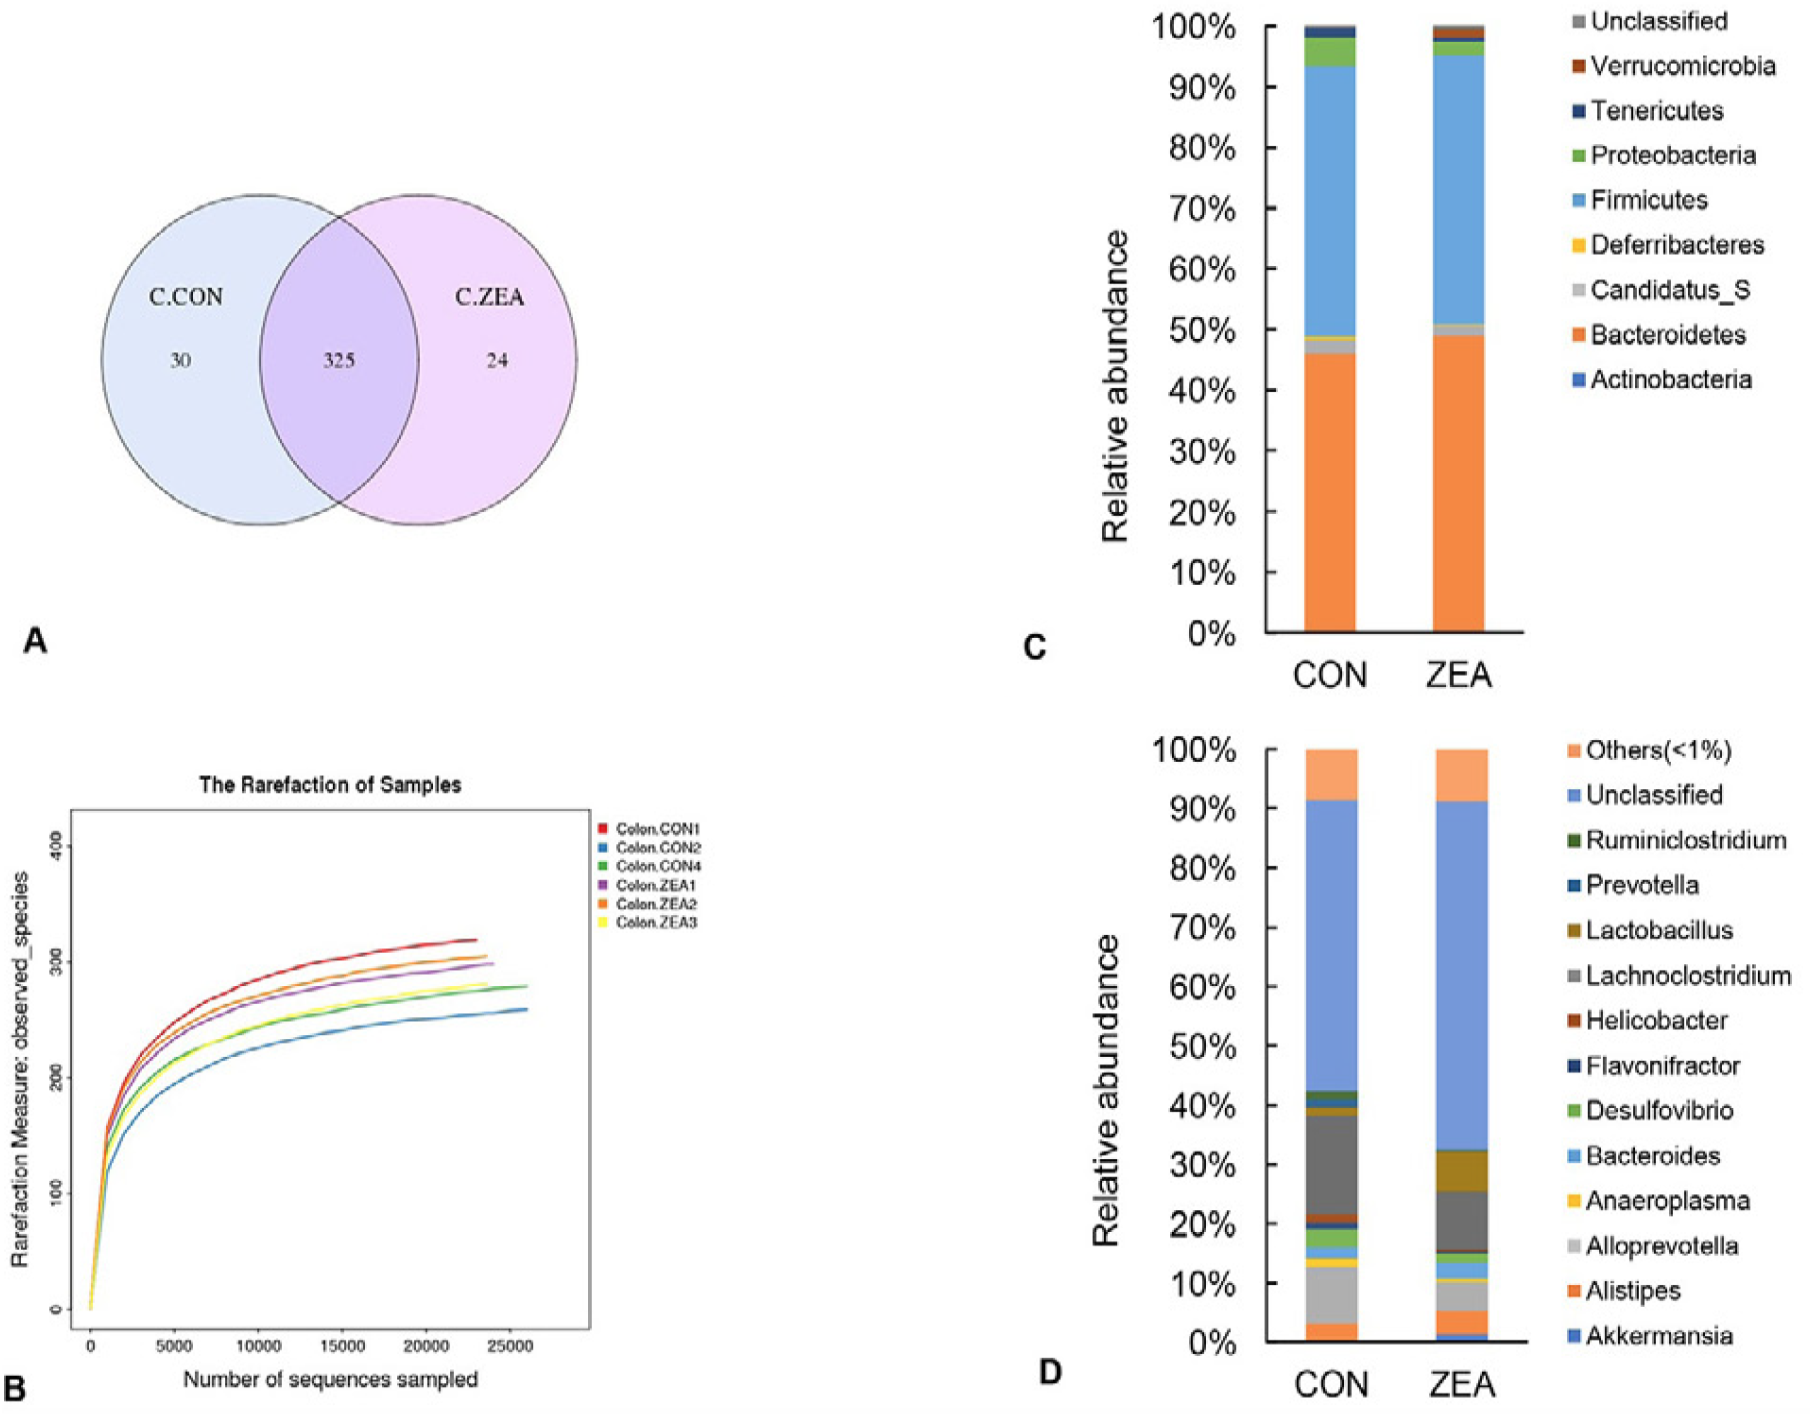
Fig. 2.
Effect of ZEA on the intestinal microflora. (A), comparison of OTU. (B), rarefaction curves based on the observed species values. (C), relative abundance of different bacterial phylum. (D), relative abundance of different bacterial genus.
