
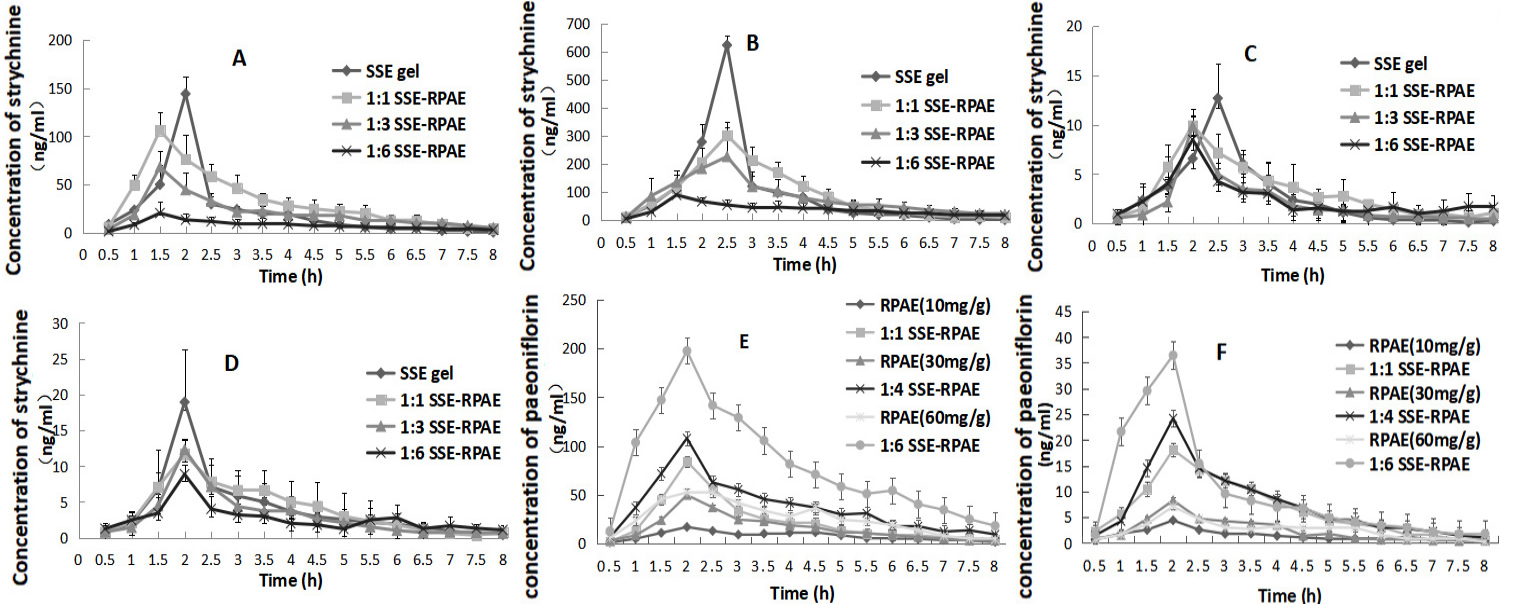
Fig. 3.
Mean concentration-time profiles of the in vivo pharmacokinetic study after transdermal administration of different proportions of gels; (A): brucine in skin; (B): strychnine in skin; (C): brucine in brain; (D): strychnine in brain; (E): paeoniflorin in the skin; (F): paeoniflorin in the brain.