
Figure 2
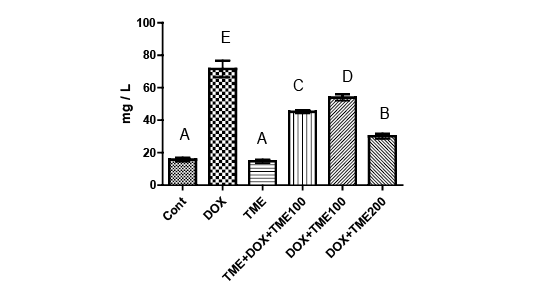
Serum iron (mg/L) of rats in control group and under the influence of different treatments. Each bar represents a mean value ±SE and the presence of different letter on the bar means a significant difference between groups
Serum iron (mg/L) of rats in control group and under the influence of different treatments. Each bar represents a mean value ±SE and the presence of different letter on the bar means a significant difference between groups