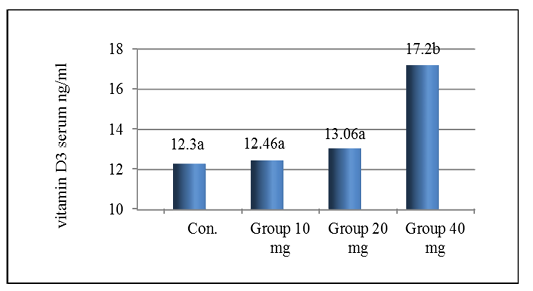
Figure 2
The mean (n=8) serum vitamin D3 level (ng/ml) in the study groups.
a-d Different letters indicate standard deviation (P≤0.05).