Figure 2
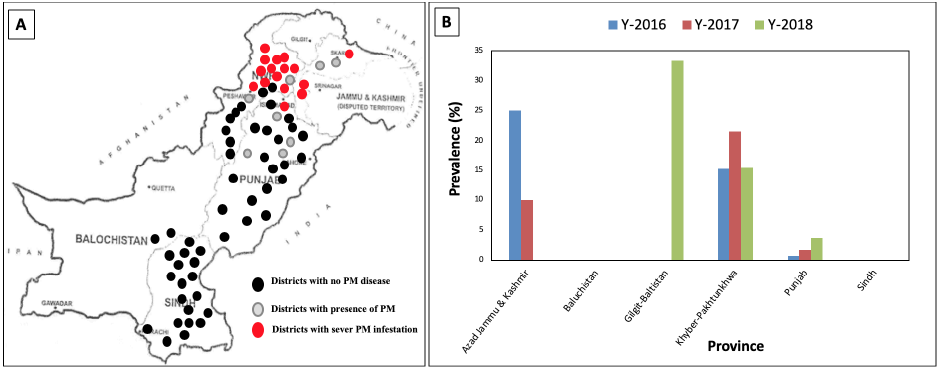
Distribution of powdery mildew across Pakistan. A: Map of Pakistan with locations surveyed over the three years. Each point represents districts surveyed, while the red dots represent locations with high powdery mildew (>4% infection), grey dot represents detection of powdery mildew (<40%) and black dots shows location with no powdery mildew. B: Percent of fields surveyed where powdery mildew was detected.