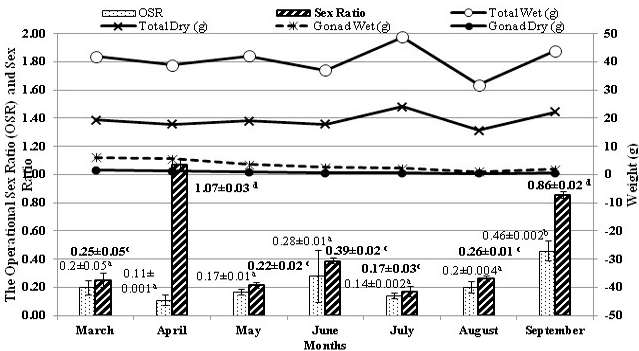
Fig 3
Different parameters of E.mathaei from March to September, 2014. Bars (left vertical axis): the operational sex ratio and sex ratio (Mean ± Standard Deviation). The different alphabet above numbers as a superscript show significant differences between months (p<0.05). Lines (right vertical axis): the total wet weights, the total dry weights; the gonad wet weights, and the gonad dry weights.