
Fig. 2.
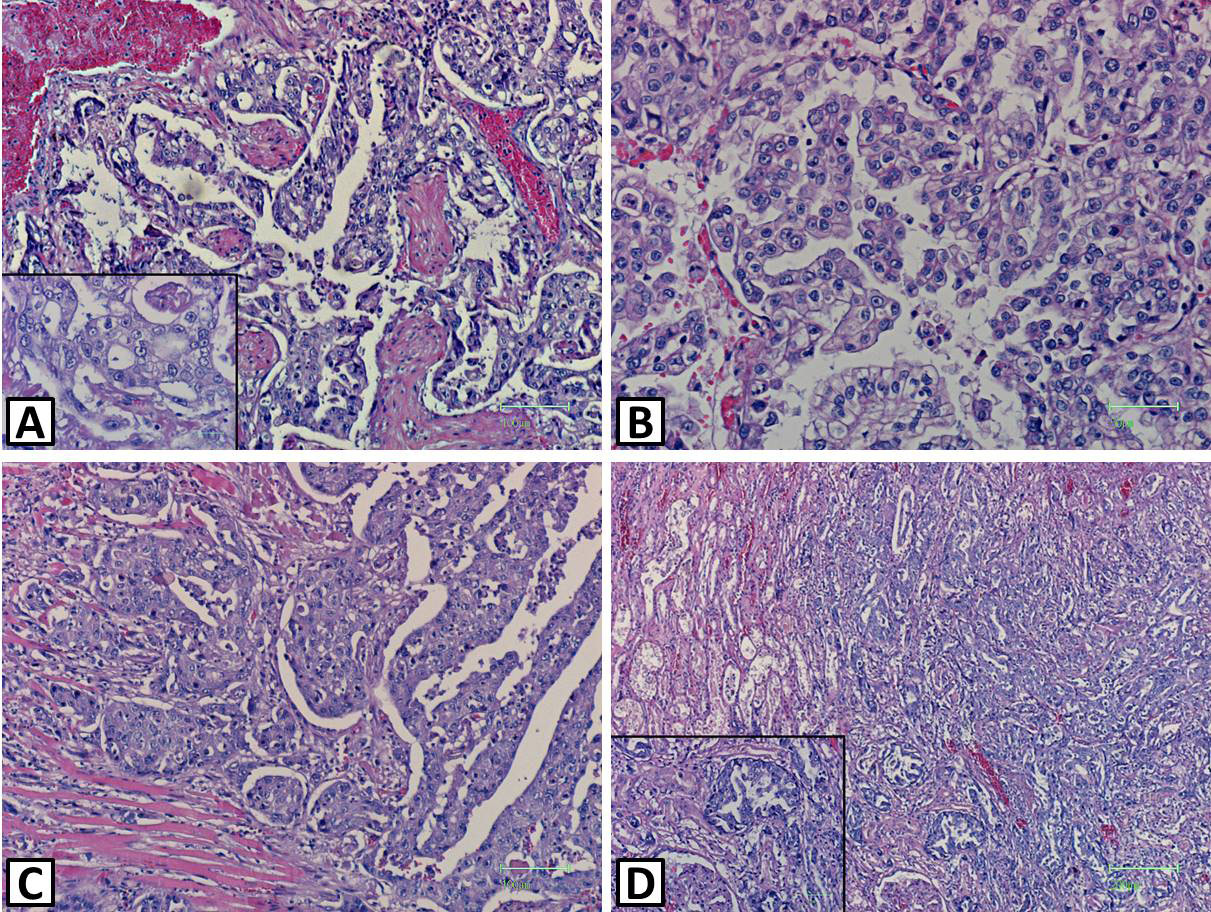
Puma concola. Papillary growth pattern of the adenocarcinoma cells in the liver (A and B), heart (C) and kidney (D). H&E. Scale bar=25 um (A inset), 50 um (B, D inset), 100 um (A,C) and 200 um (D).
Puma concola. Papillary growth pattern of the adenocarcinoma cells in the liver (A and B), heart (C) and kidney (D). H&E. Scale bar=25 um (A inset), 50 um (B, D inset), 100 um (A,C) and 200 um (D).