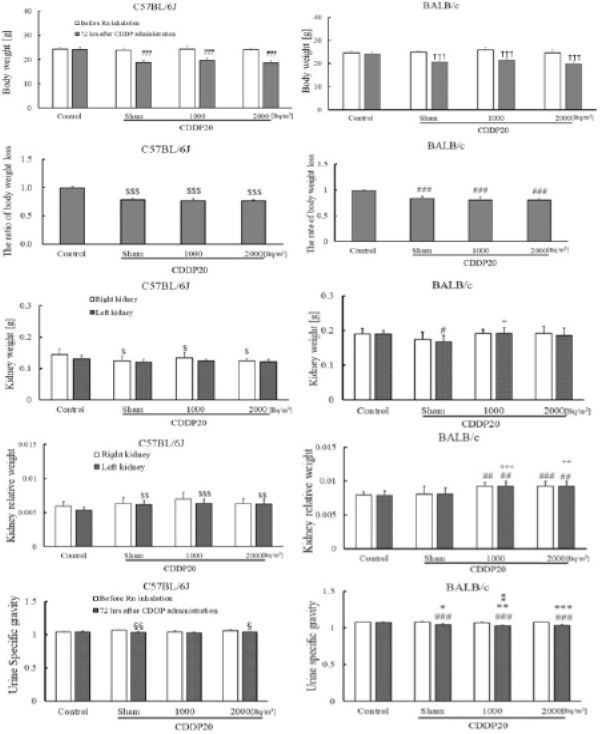
Effects of radon inhalation on the influence of 20 mg/kg CDDP administration in body weight, the rate of body weight loss, absolute and relative kidney weight, and urine specific gravity in C57BL/6J and BALB/c mice with CDDP-induced renal injury. ¶¶¶P < 0.001 compares the data of the treatment groups vs. the control measured at 72 h after CDDP administration in the C57BL/6J strain; the sham group received 20 mg/kg CDDP only with air inhalation. †††P < 0.001 indicates the comparison of the treatment groups vs. the control in the BALB/c strain at 72 h after CDDP administration. $P < 0.05, $$P < 0.01, $$$P < 0.001 indicate comparisons of the treatment group vs. the control in the C57BL/6J strain.# P < 0.05, ## P < 0.01, ### P < 0.001 indicate the treatment groups vs. the control in the BALB/c strain. §P < 0.05 and §§ P < 0.01 compare data at 72 h after CDDP administration vs. before radon inhalation in the C57BL/6J strain. * P < 0.05, ** P < 0.01, and *** P < 0.001 compare the data at 72 h after CDDP administration in the treatment groups vs. before radon inhalation in the BALB/c strain. +P < 0.05, ++P < 0.01, and +++P < 0.001 indicate the CDDP and radon inhalation groups vs. the sham in the BALB/c strain. :P < 0.05 indicates the CDDP and 1000 Bq/m3 inhalation group vs. the sham in the BALB/c strain.