
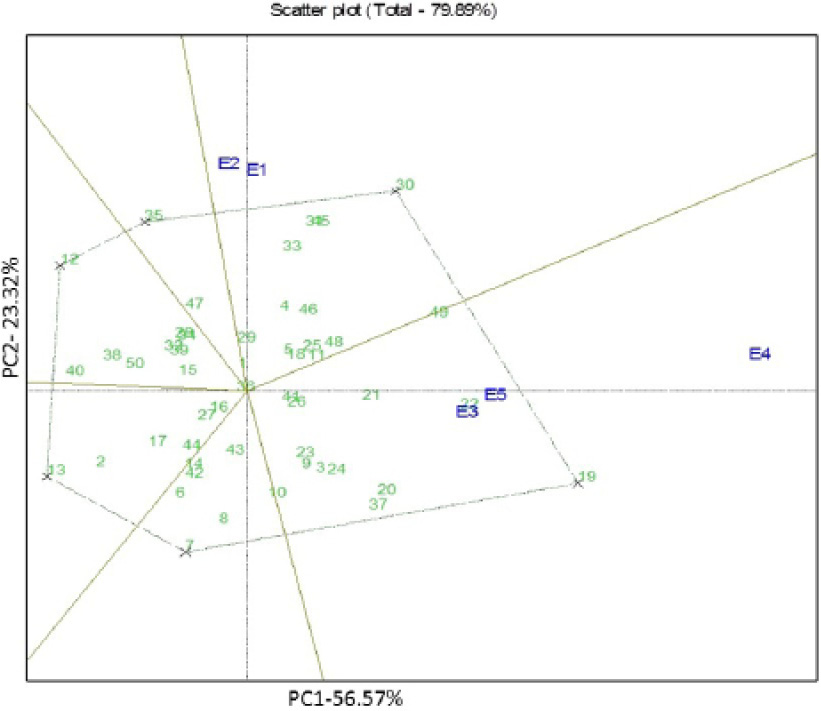
Figure 2
“Which-won-where” pattern of GGE biplot based on mean yield of 50 wheat genotypes evaluated across five environments, 2011/12 and 2012/13 .
“Which-won-where” pattern of GGE biplot based on mean yield of 50 wheat genotypes evaluated across five environments, 2011/12 and 2012/13 .