
Figure 2
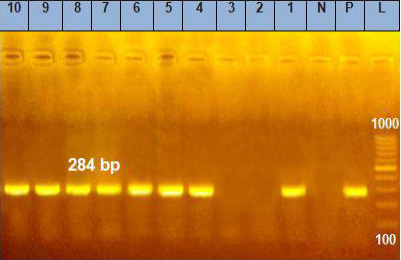
Gel electrophoresis UV images showing representative samples with positive bands (1 and 4: 10) and negative samples (2 and 3) compared to the ladder, positive, and negative controls.
Gel electrophoresis UV images showing representative samples with positive bands (1 and 4: 10) and negative samples (2 and 3) compared to the ladder, positive, and negative controls.