View larger version:
Download Original File
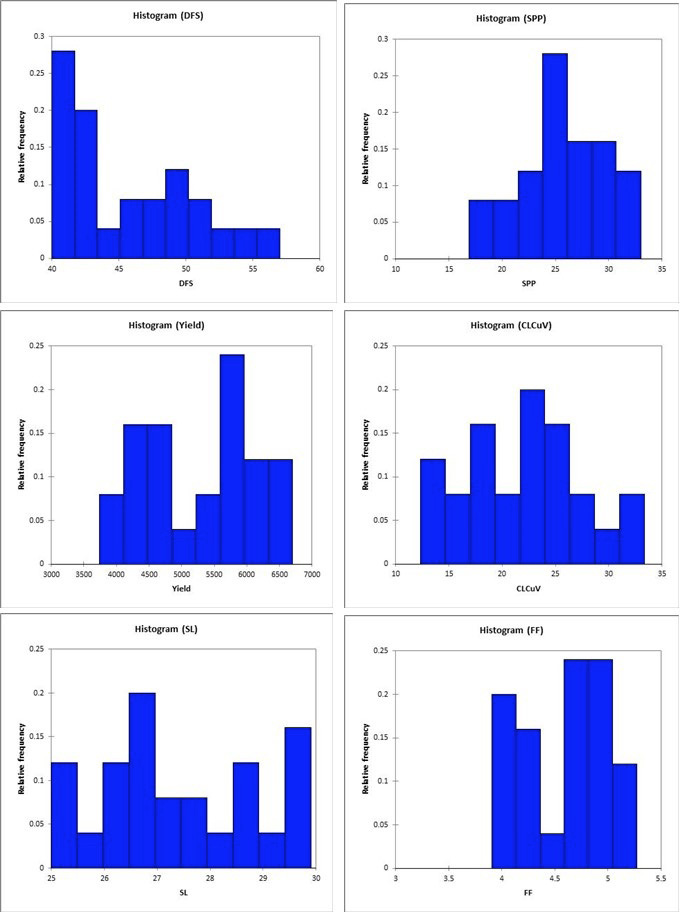
Figure 1:
Different patterns of frequency distribution shown by 25 cotton genotypes.
