
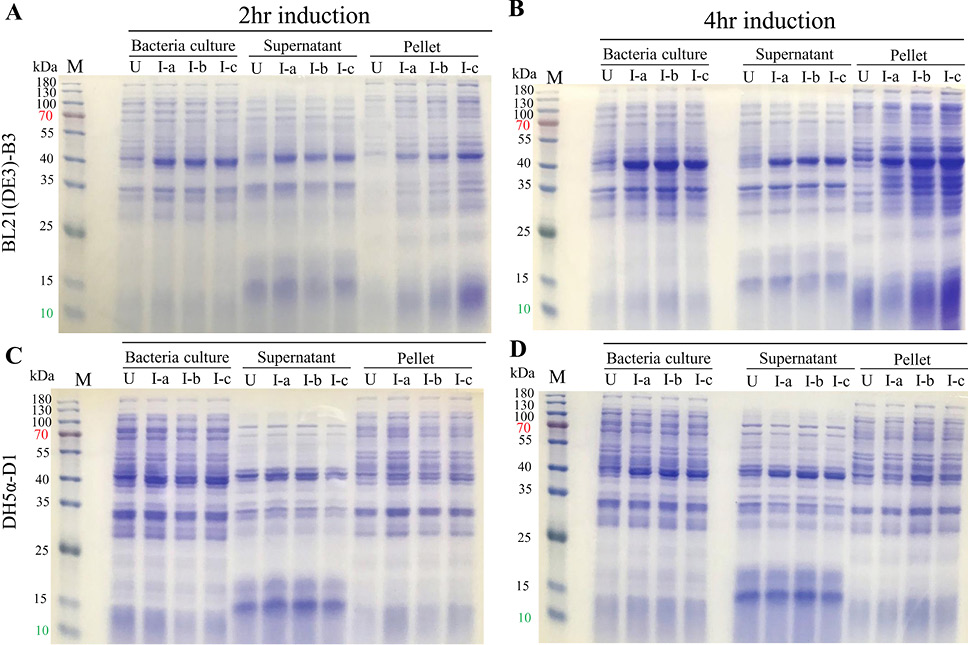
Fig. 4.
Optimization of expression condition compared by SDS-PAGE. Samples collected and prepared directly using bacteria culture as well as the expression formats were analyzed by SDS-PAGE. B3 hAD expression strain was cultured and induced under induction of 3 concentrations of IPTG, for 2 hours (A) or 4 hours (B), as well as D1 strain cultured and induced for 2 hours (C) and 4 hours (D). U, uninduced; I, induced; S, supernatant; P, pellet; I-a, 0.1mM IPTG induced; I-b, 0.5mM IPTG induced; I-c, 0.5mM IPTG induced; M, protein marker.