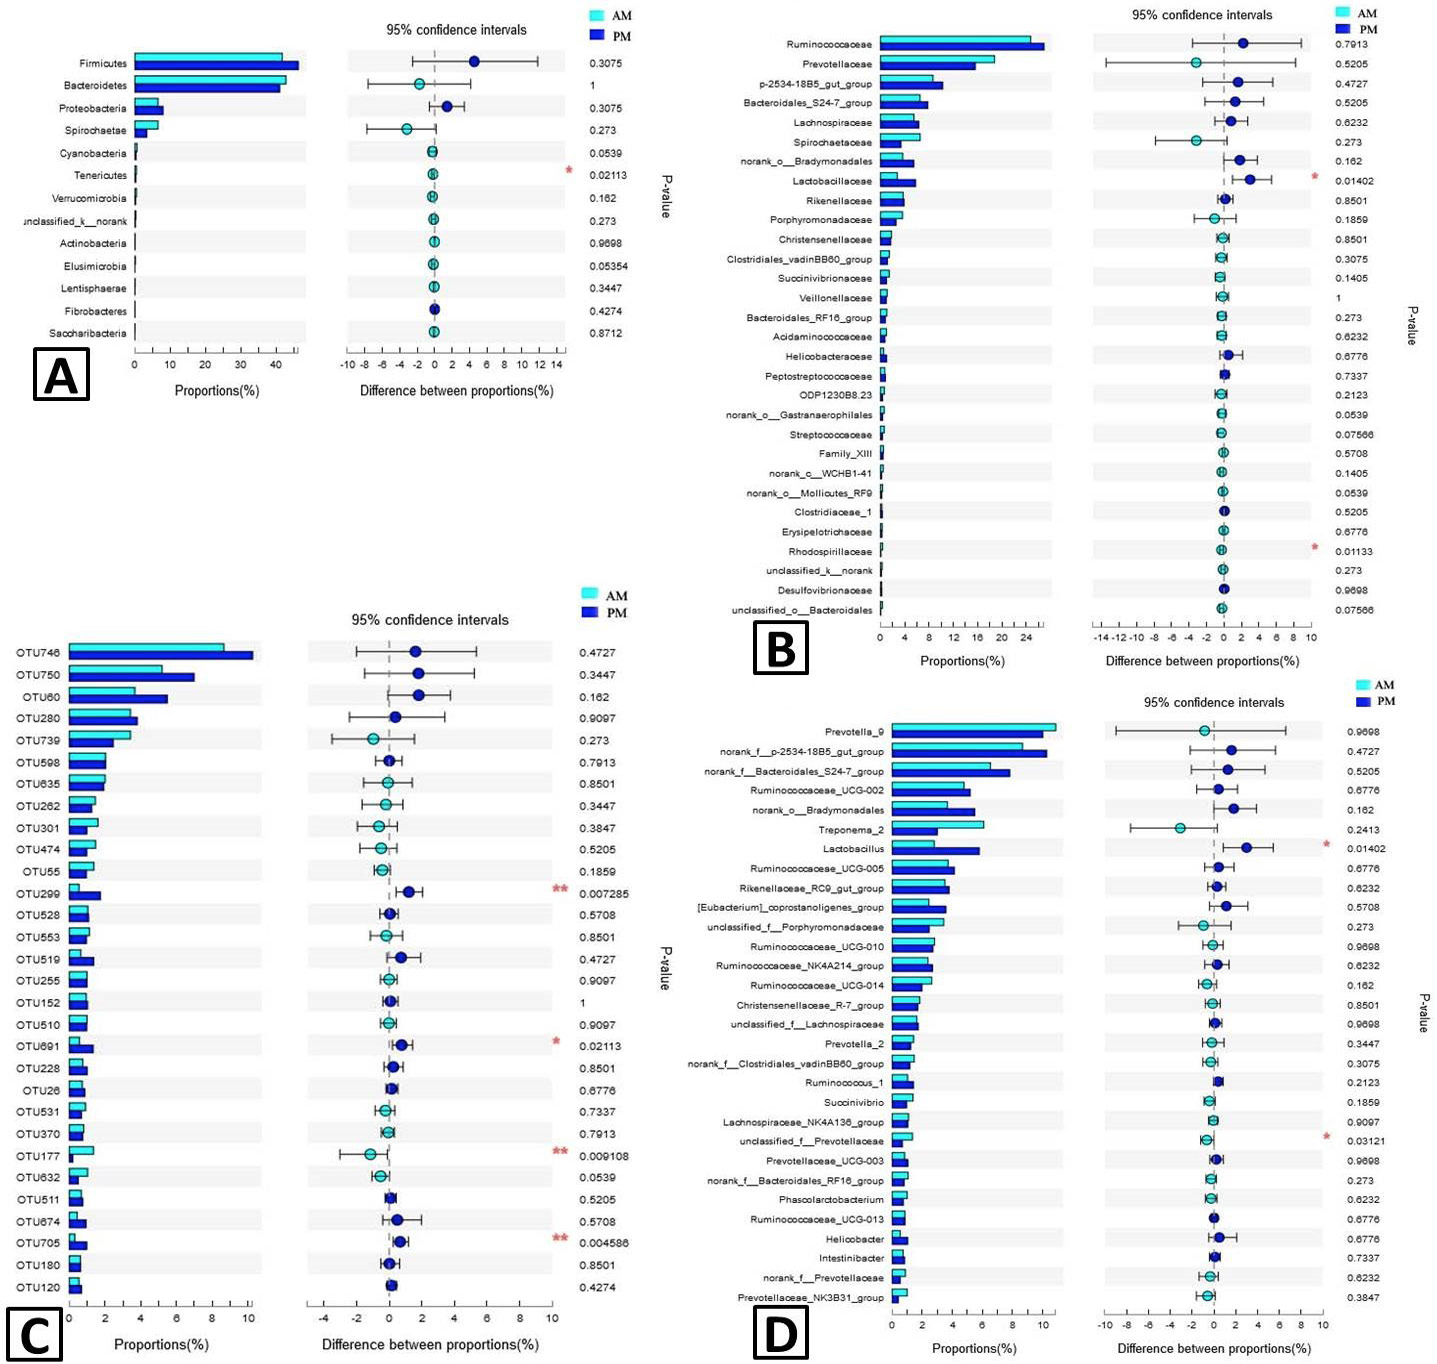
Fig. 4.
Bar plot for comparison of microbial communities between two groups at phylum (A), family (B), genus (C) and OTU (D) levels. AM, morning group; PM, afternoon group.
Bar plot for comparison of microbial communities between two groups at phylum (A), family (B), genus (C) and OTU (D) levels. AM, morning group; PM, afternoon group.