
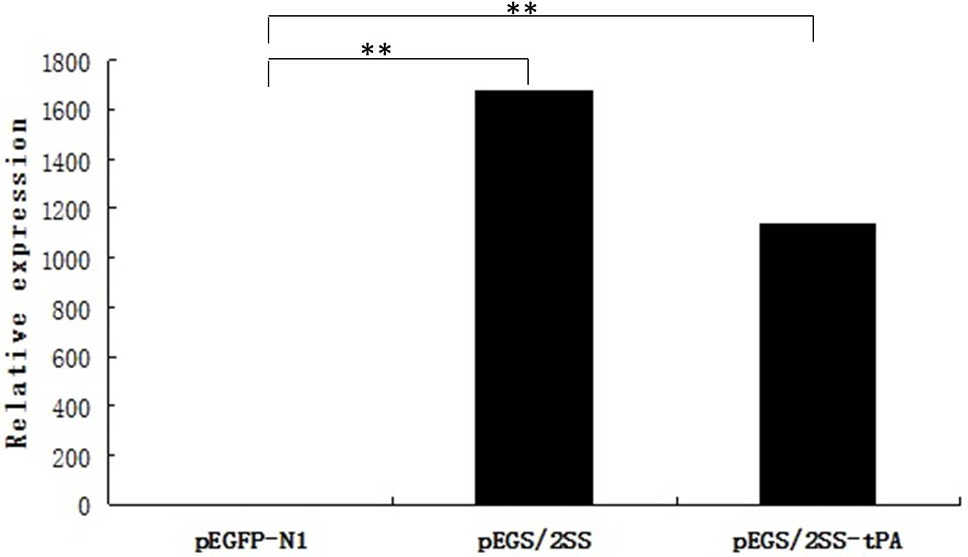
Fig. 3.
Relative expression of SS mRNA by real-time PCR. The Ct value of SS was normalized to that of GAPDH, and the SS expression level in cells transfected with pEGS/2SS-tPA or pEGS/2SS was calculated relative to cells transfected with pEGFP-N1. **P<0.01.