
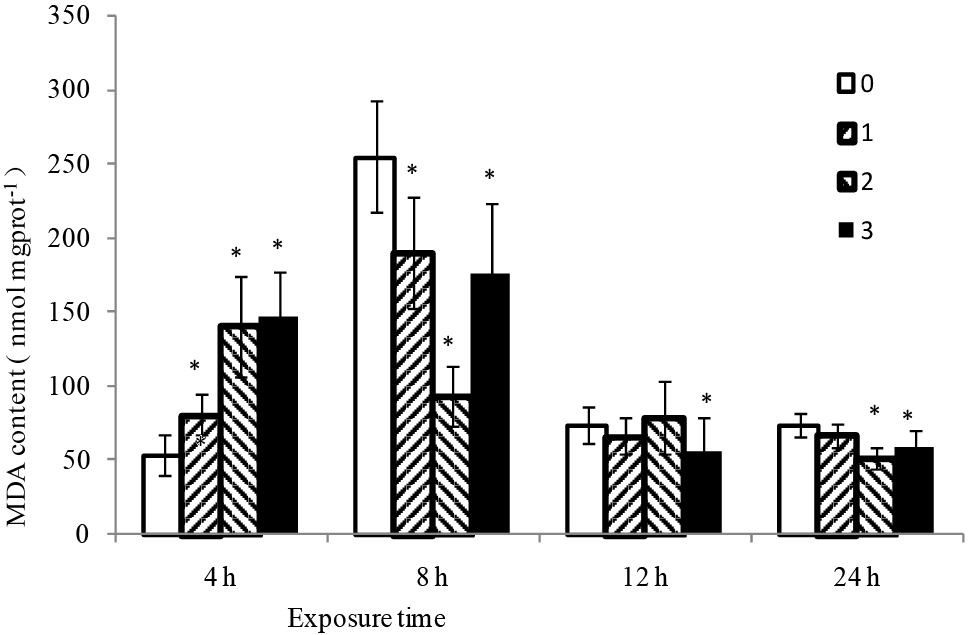
Fig. 1.
MDA content in the fat bodies of A. pernyi exposed to different concentration of uranyl acetate. The values represent mean±SE (n=3). For each experiment, samples were analyzed in triplicate. (0, Control; 1, 6.25 mM; 2, 12.5 mM; 3, 25 mM.).