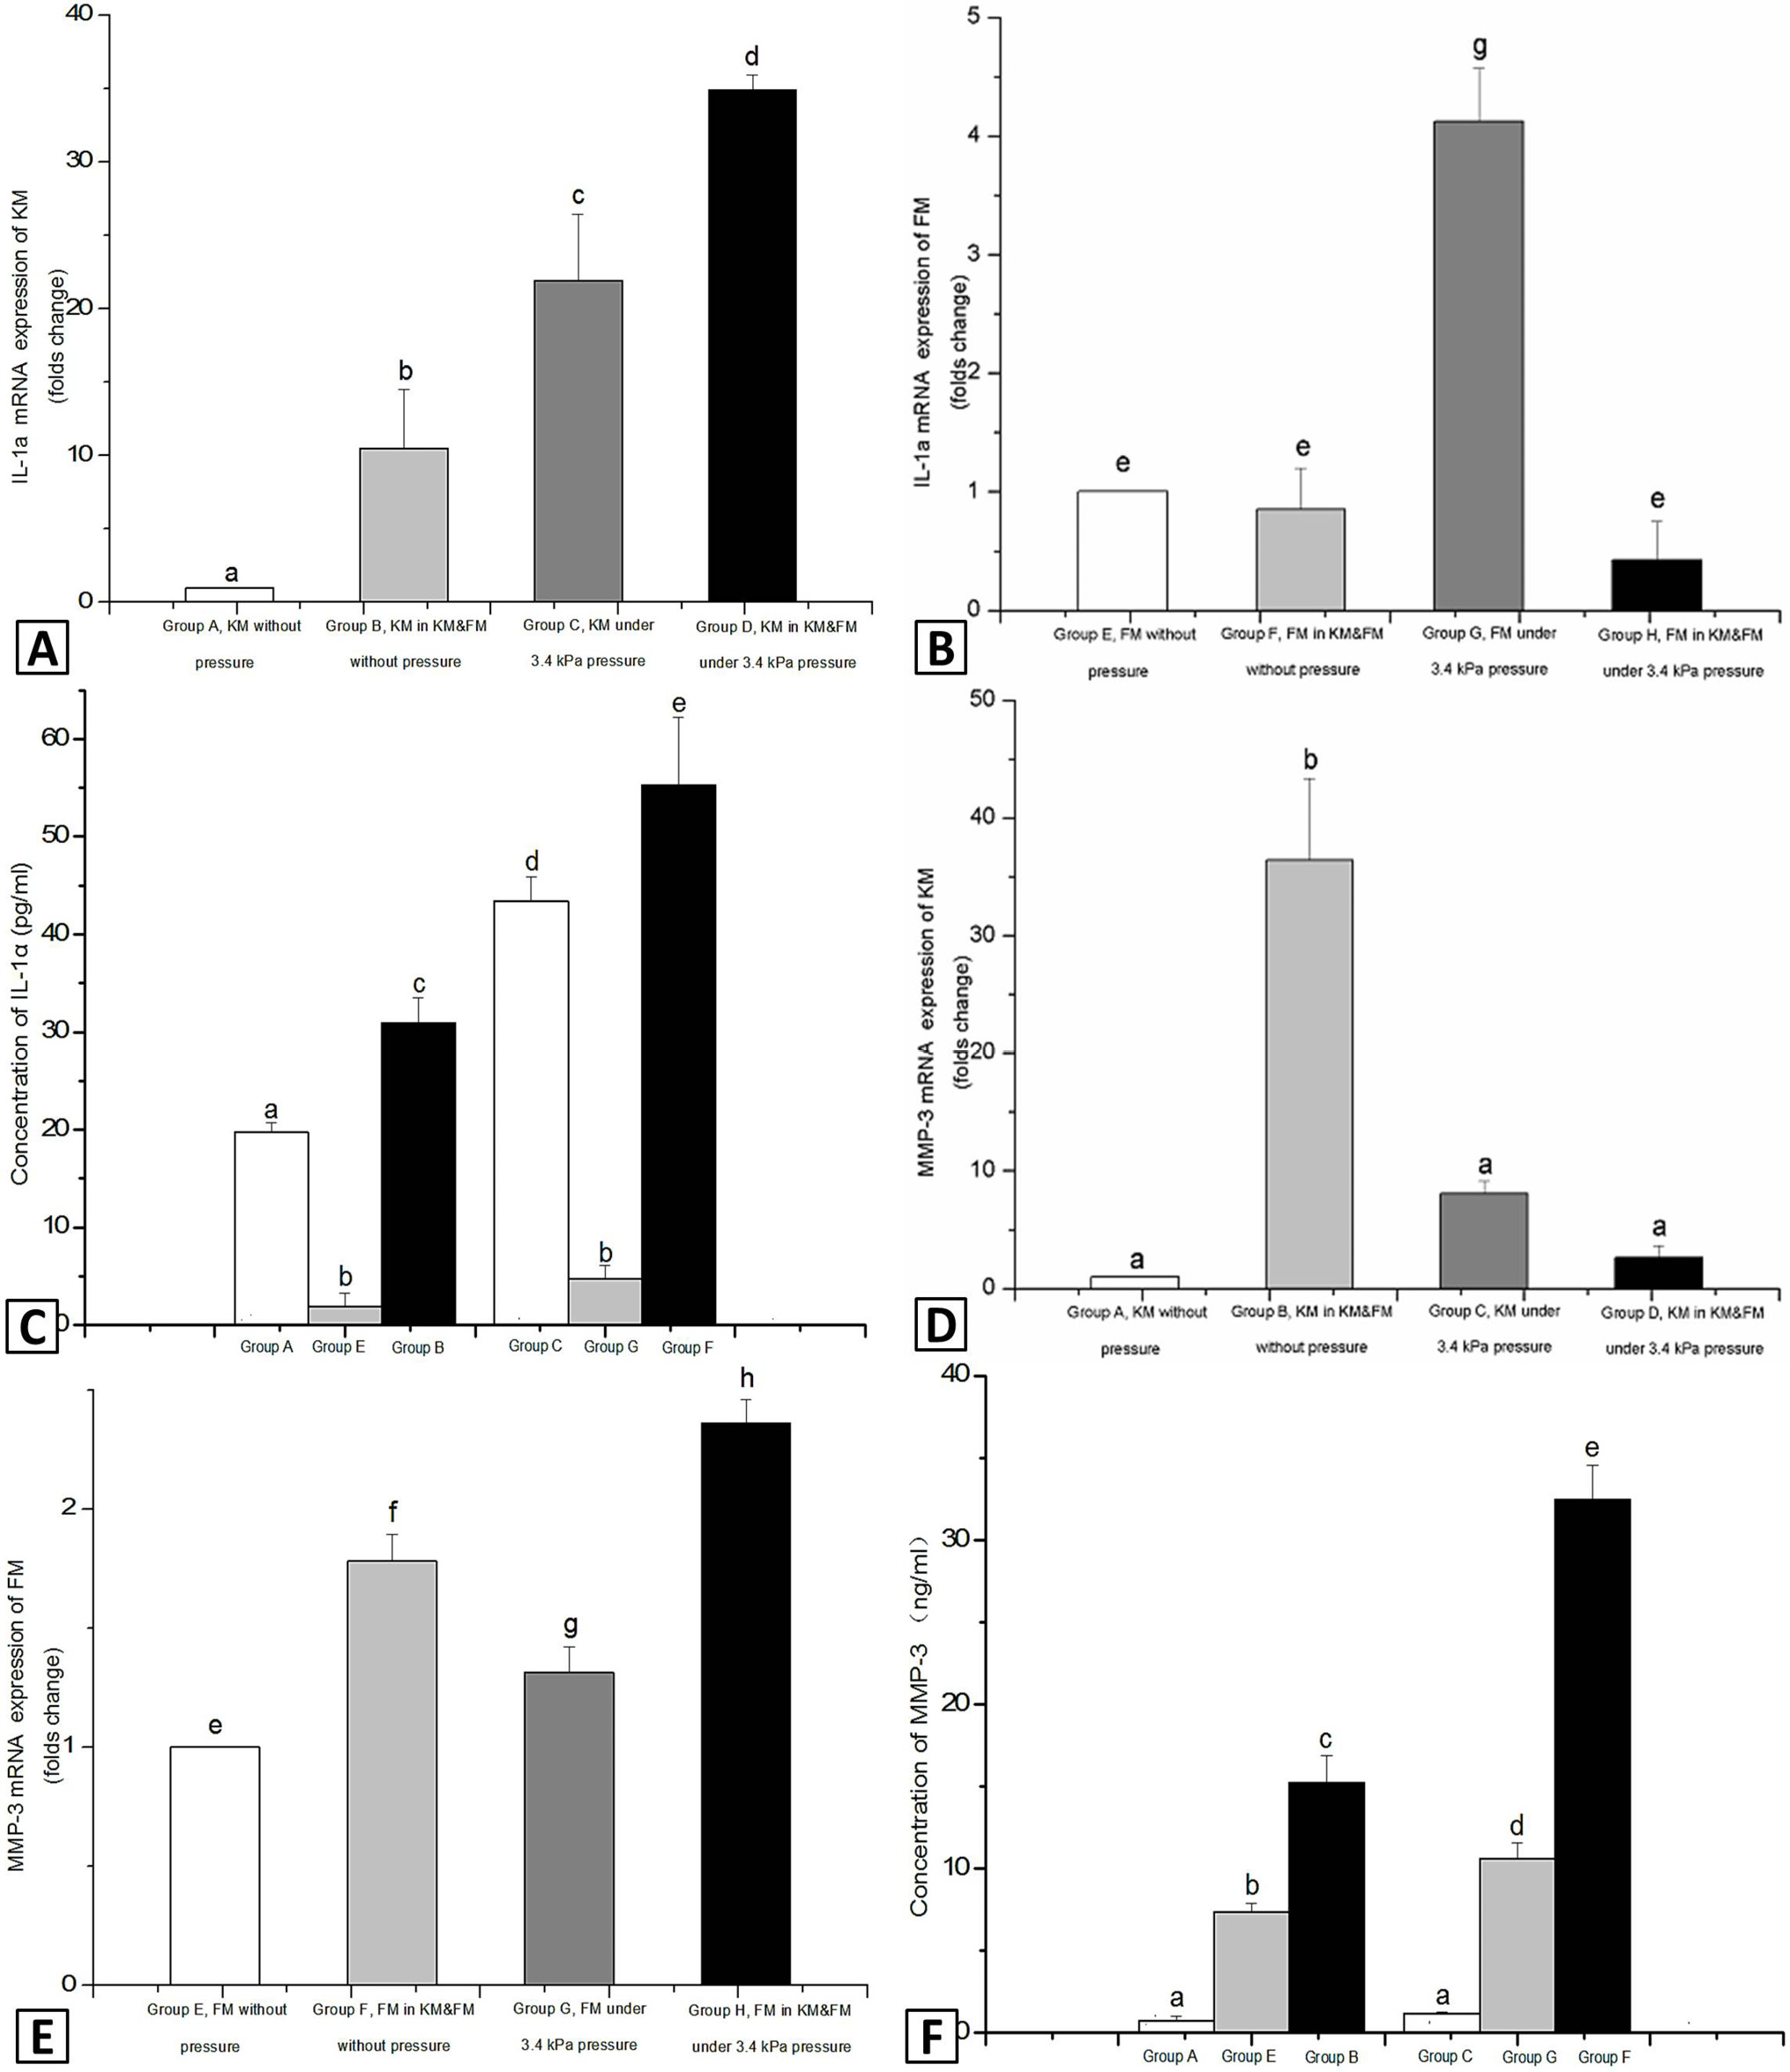
Fig. 3.
A, the comparation expression of IL-1α mRNA in KM; B, the comparation expression of IL-1α mRNA in FM; C, the production of IL-1α; D, the comparation expression of MMP-3 mRNA in KM; E, the comparation expression of MMP-3 mRNA in FM; F, the production of MMP-3: a to d shows significant difference of protein concentration of KM (*P<0.05), and e and f shows significant difference of protein concentration of FM (*P<0.05). n=3.