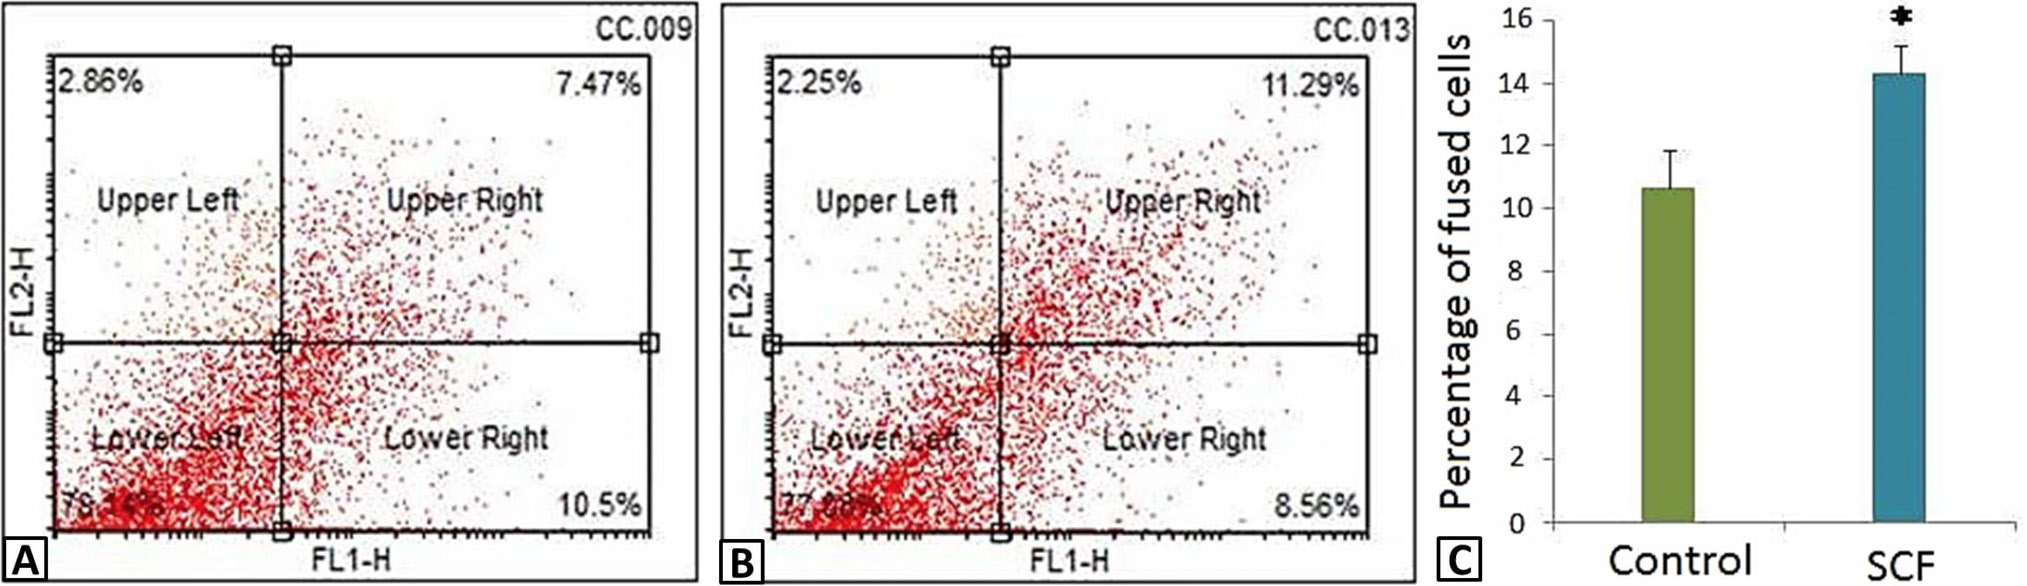
Fig. 4.
Co-culture analysis of SCF transfected MSCs with CMs thorugh flow cytometry: (A) Co-culture of normal MSCs and normal CMs (control), and (B) SCF transfected MSCs and CMs. MSCs were labeled with PKH26 and CMs with PKH67. (C) Corresponding bar diagram showing quantitative analysis of double positive cells. Results are expressed as Mean ± SEM (n = 3). Differences between groups with P < 0.05 is considered statistically significant where *P < 0.05, **P < 0.01, and ***P < 0.001.