
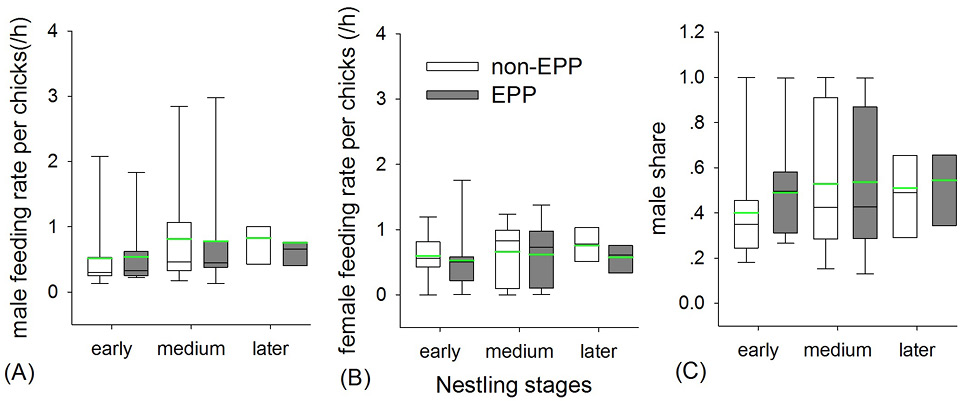
Fig. 2.
Parental provisioning rates of varied tit toward individual chicks in relation to EPP (sample sizes for early, medium and late nestling stages are 9, 10 and 8 for both non-EPP and EPP nests). No significant differences between EPP and non-EPP group in each nestling stage (post-hoc Tukey HSD test (all p≥0.339). Boxplots and the whiskers show 25%, 75 % and the 5%, 95% of the data respectively. Black lines represent the median values and green lines the mean values.