
Fig. 3.
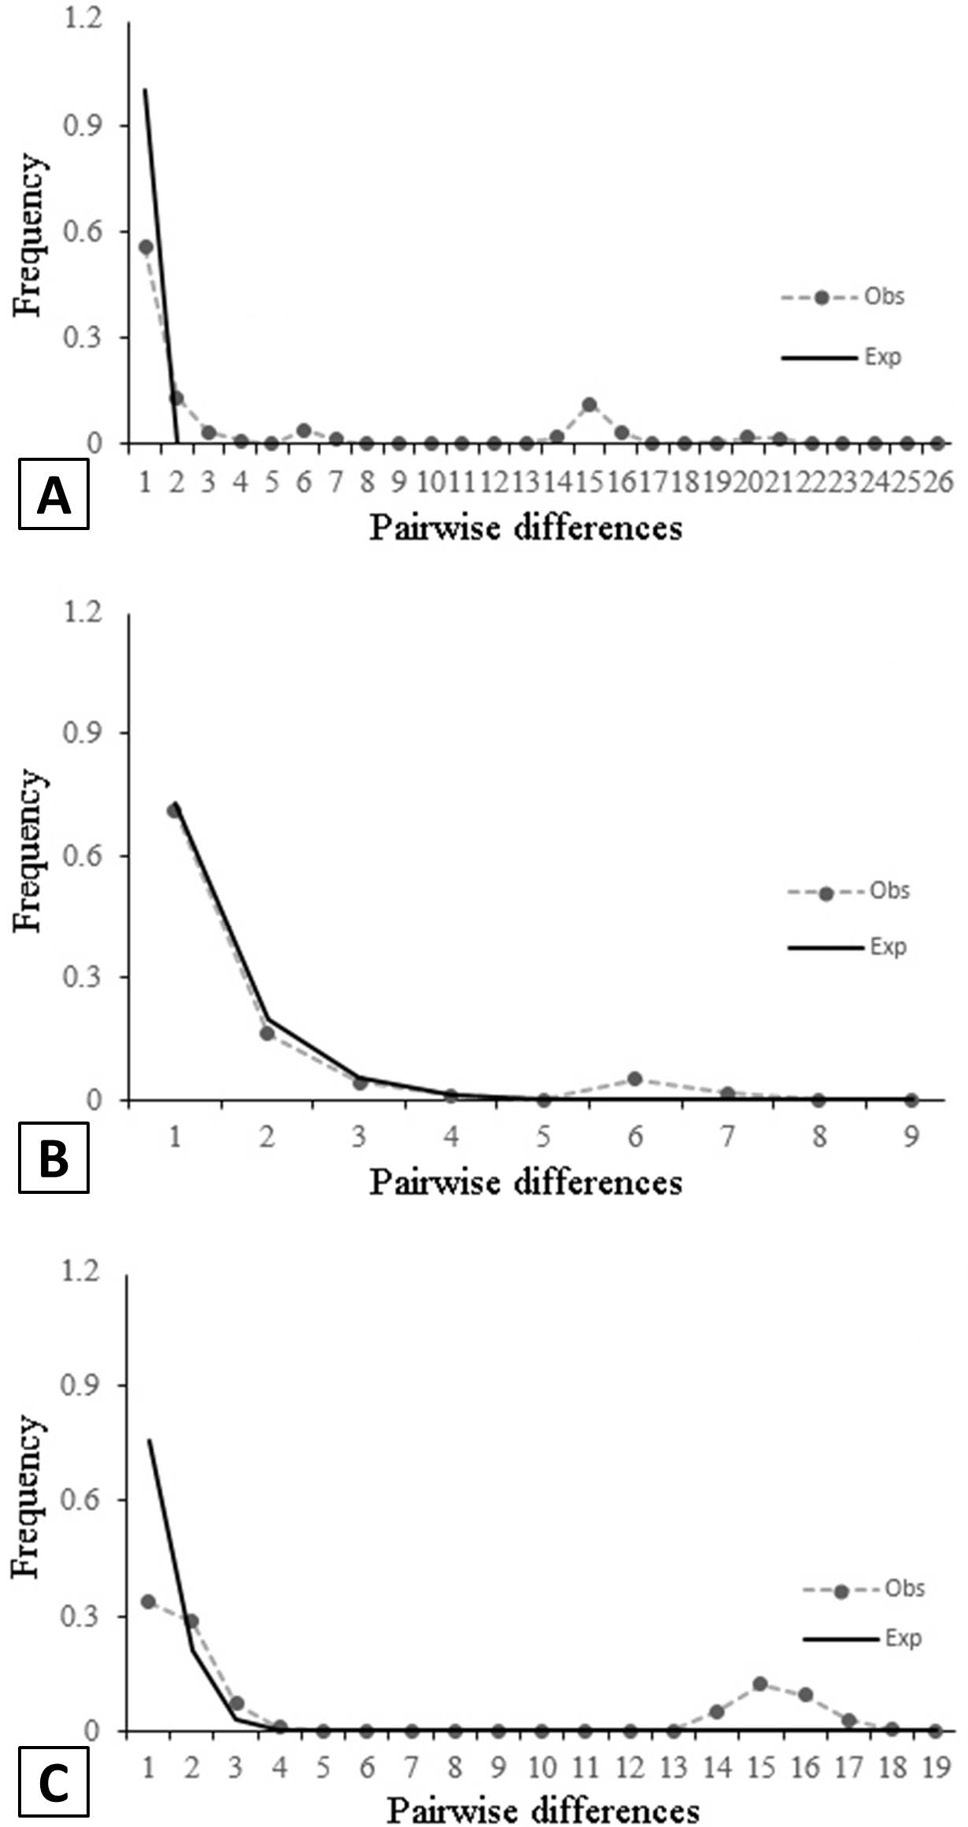
Mismatch distribution of all populations (A), northern Australia populations (B) and South China Sea populations (C). The solid line represents the curve expected (Exp.) based on the expansion model. Obs., observed.
Mismatch distribution of all populations (A), northern Australia populations (B) and South China Sea populations (C). The solid line represents the curve expected (Exp.) based on the expansion model. Obs., observed.